How the Delft Municipal Data Model came about
Overview
The Delft Municipal Data Model (Dutch: Gemeentelijk Gegevensmodel, abbreviated GGM) was designed on the basis of interviews with domain experts, the applications used in Delft and national information standards. The aim was a data model with strong grounding in the Delft situation. The elaboration of Municipal Monuments is included as a worked example. Since all Dutch municipalities essentially share the same statutory tasks, we assume the underlying information models will be largely similar.
The starting points of the inventory were:
- The list of Delft applications and their inventory, distinguishing between authoritative sources and other applications.
- The set of policy domains in which the municipality has tasks.
- Nationally established standards for data exchange and nationally established information models.
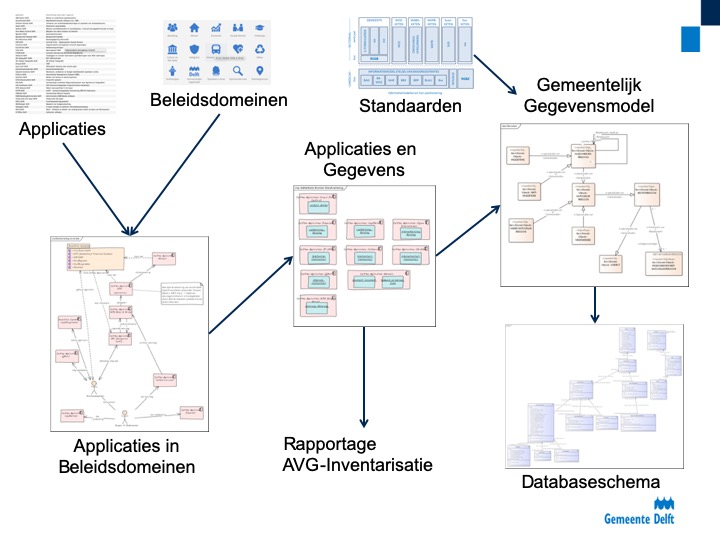
Diagram (in Dutch): "Aanpak GGM" — interviews → application & data inventory → data model → database schema generation.
The inventory was carried out in the following steps:
- Applications and policy domains — interviews with experts per policy domain. For each domain, conversations with information-management experts produced an inventory of the applications used, the users involved, the interactions between them, and the data used.
- Applications and data — by identifying authoritative sources during the conversations, zooming in on the data used, and using the application/data inventory, the data within authoritative sources were identified. Details of the data used were captured by photographing application screens and/or analysing the underlying database schema.
- GGM — the data model is built up by translating the data found in the previous step into object types. National standards serve as the starting point as much as possible, with the new data fitted in. Many applications support these standards, ensuring compatibility.
- Database schema — a generator was built that produces database tables (DDL) from model definitions 'at the press of a button'. This makes it possible to lay the foundation for a data warehouse and load data from applications, enabling confrontation of the model with real data.
Information analysis explained
The aim of the information analysis is to find the data used within the various policy domains, determine the right data definitions (object types), and determine the relationships between those object types. Although you inventory which tasks are performed in a domain, the goal is not a full process analysis — we are looking for data. For each policy domain you go through the cycle described here. Good inventories of tasks during interviews are important, and the elaboration should be as understandable as possible to the interviewee, so they can verify whether you are correct and complete.
The conceptual steps below are performed per policy domain, with a worked example available in Municipal Monuments.
Inventorying applications and policy domains
The aim of this step is to determine, through interviews — starting from the previously inventoried applications:
- Scope, purpose and background of the work in the policy domain.
- The tasks that (must) be performed in the domain.
- The applications and other administrations used.
- The tasks performed with these applications.
A worked example of this phase is available here and here (in two parts) and produces among other things:
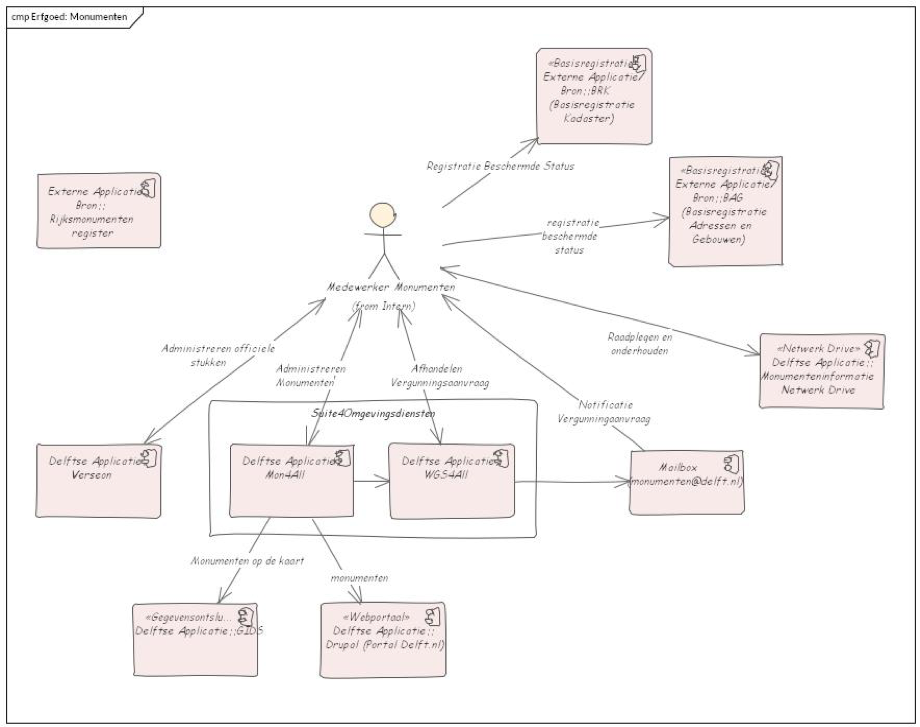
Diagram (in Dutch): inventory of the applications used in the Monuments domain.
Inventorying applications and data
The previous step yielded a finite list of the applications used and the tasks performed with them. The aim of this step is to determine which data each application administers, and for which data each application is the authoritative source. This produces a complete picture of the relevant data within the domain.
During interviews you can take photos of the applications, analyse the underlying database schemas, or use the application manuals — depending on availability. Process the results in your analysis document so the interviewee can verify them.
A worked example of this phase is here. It shows the various applications with the data they hold:
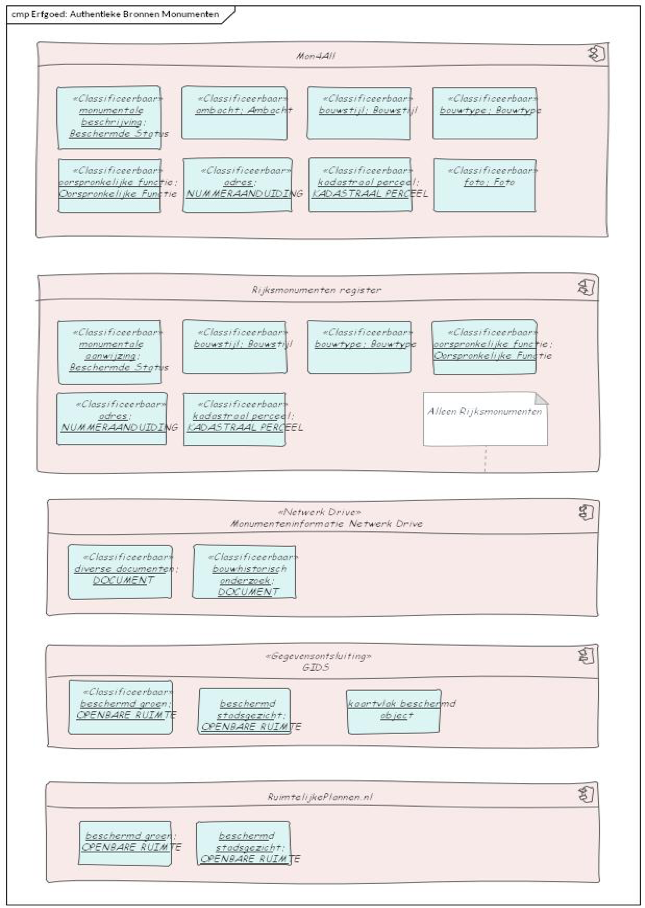
Diagram (in Dutch): per-application overview of the data administered for Monuments.
Extending the GGM
The previous step inventoried which data is used within the policy domain. In this step, the inventory is used to translate that data into object types. In addition to the inventoried data, you build on (national) data standards as much as possible. The list of national standards applied in the GGM is here. If a national standard is missing, you add it to the model — by importing or transcribing it. If you build on a standard already in the model, this is of course not needed.
In this step you extend the GGM by creating an object type per data item found, or reusing one from the existing model. Make sure you respect the layered structure. These object types and their relationships are elaborated in one or more diagrams.
A worked example of this phase is here and produces among other things:
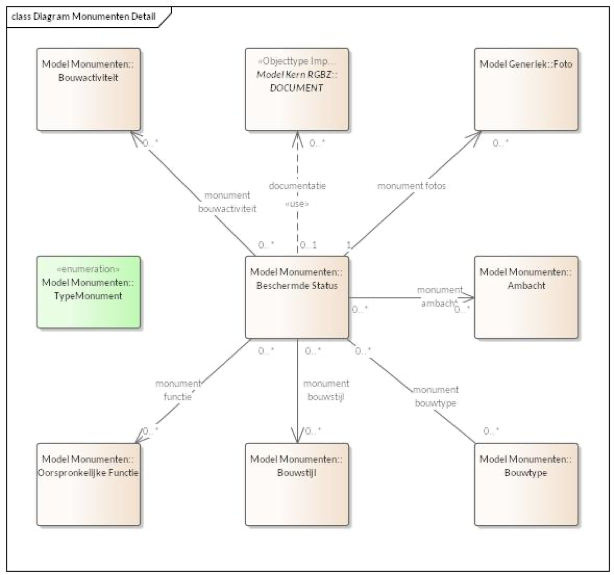
Diagram (in Dutch): the resulting object-type model for the Monuments domain.
Generating the database schema
To use the just-extended part of the GGM in a database, you can generate it to DDL. Select or copy the relevant part of the GGM and follow this guide.
Information analysis using Enterprise Architect
Below is a description of how Enterprise Architect was used in elaborating the GGM.
Before modelling
Before you start modelling, you need an Enterprise Architect project to work in. You can use the example file (Gemeentelijk_Gegevensmodel.eap) shipped with the GGM.
Modelling applications and policy domains
Much of the result of this step is text, which needs no further explanation. To model in Enterprise Architect, follow these steps:
- Open the project you want to work on in Enterprise Architect.
- Under the root node, create a new folder for the components.
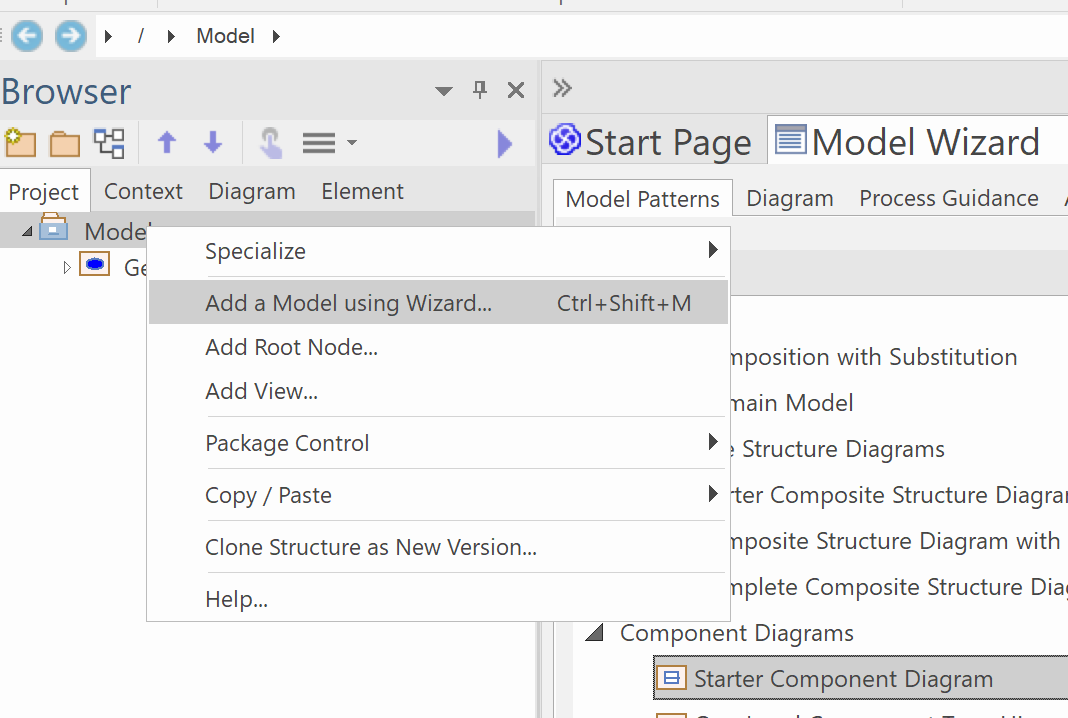
Screenshot (in Dutch / Enterprise Architect UI): creating a new folder under the root node.
3. Choose Component Diagram to add a new folder next to the GGM.
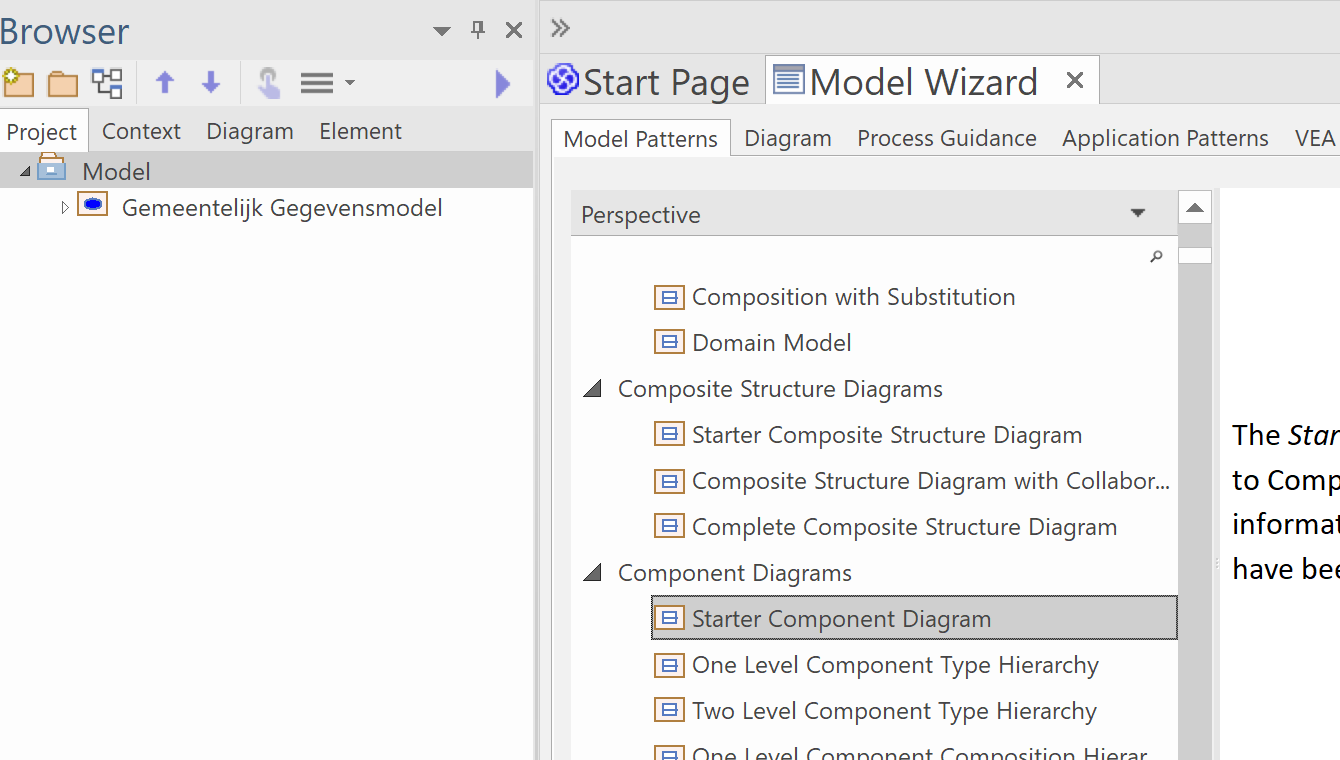
Screenshot: selecting the Component Diagram type.
4. Under the new folder, add Diagram and Model folders, and under Model create folders for actors and applications.
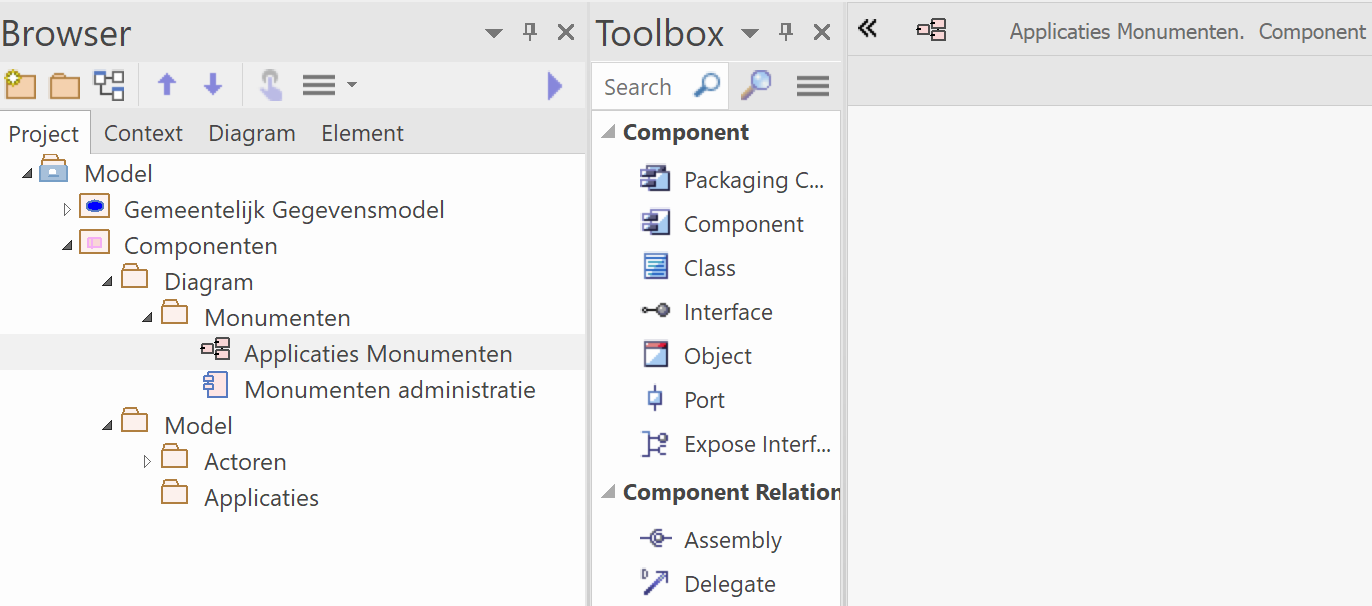
Screenshot: the resulting folder structure for actors and applications.
4b. To keep diagrams high-level and suppress element-detail display, you can disable that. Double-click the diagram and open Properties. Here you can disable showing element details.
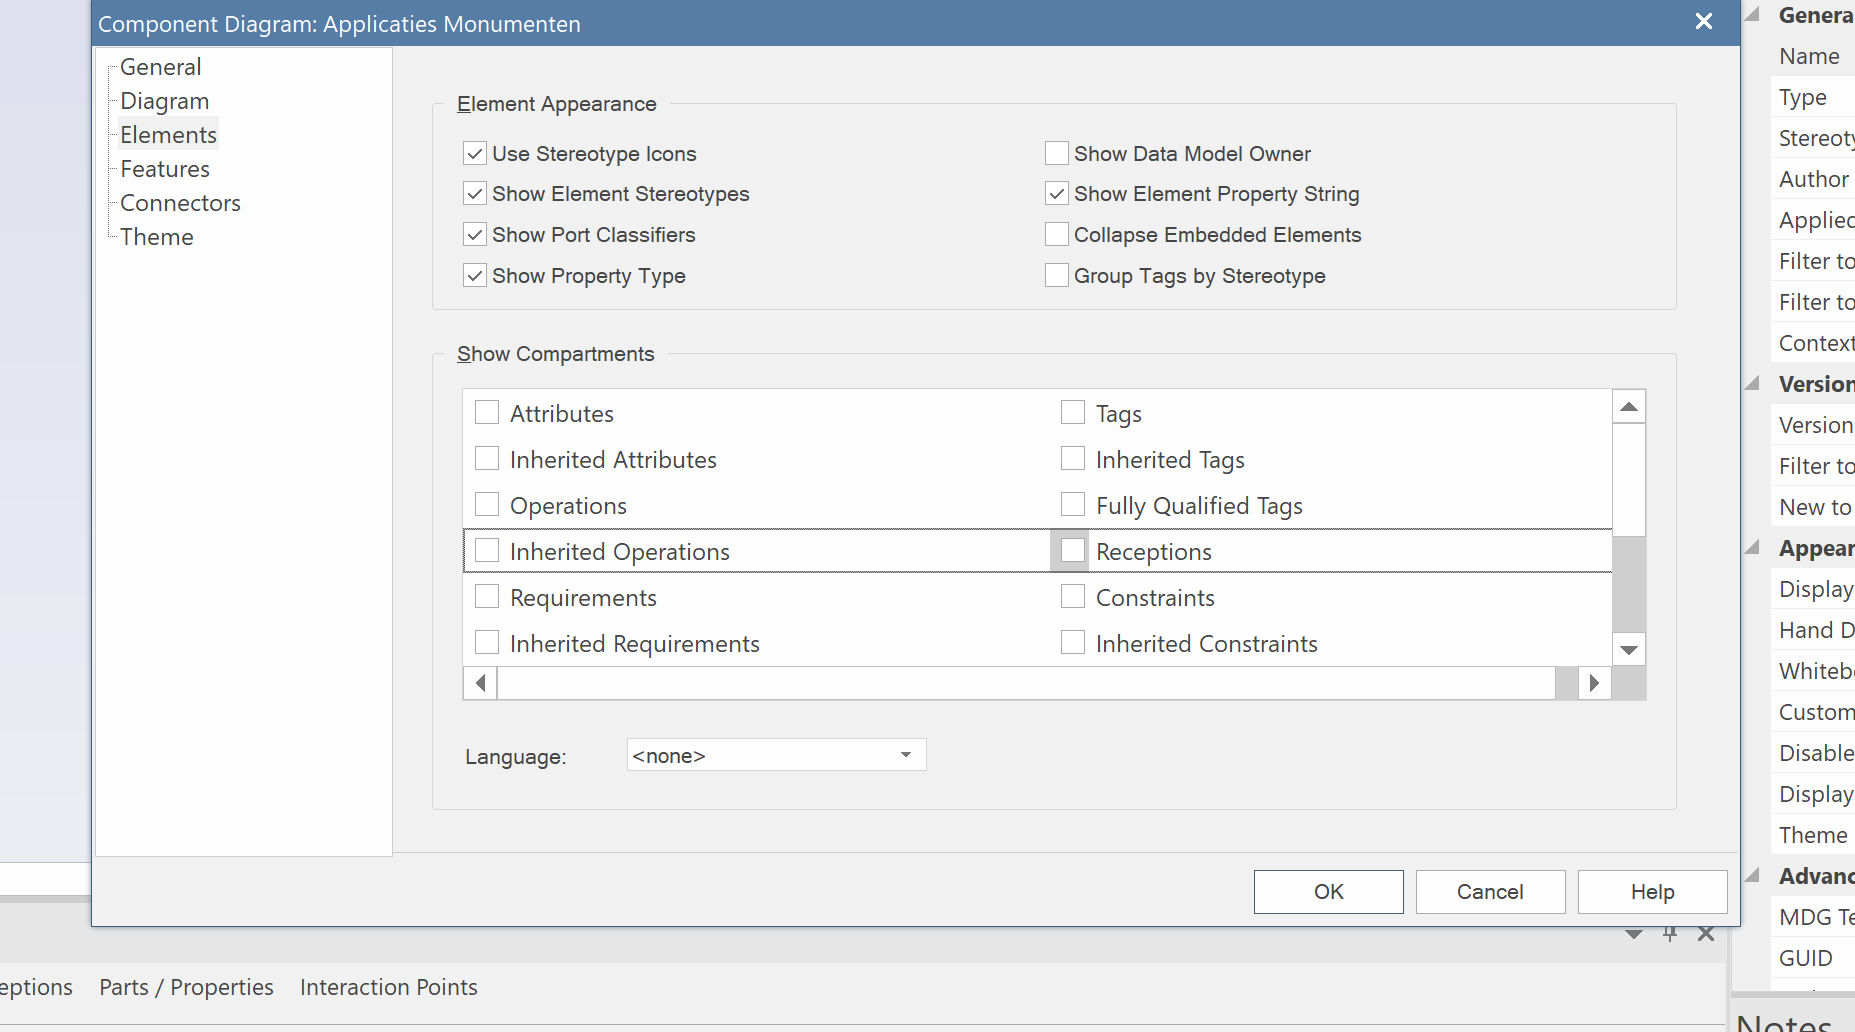
Screenshot (in Dutch / Enterprise Architect UI): the diagram Properties dialog with element-detail display disabled.
5. Extend the component diagram with the modelling at hand. Here a very simple elaboration for Monuments is shown. Also add a Use Case diagram, even though we do not actually elaborate use cases. You can of course add multiple diagrams as the situation requires.
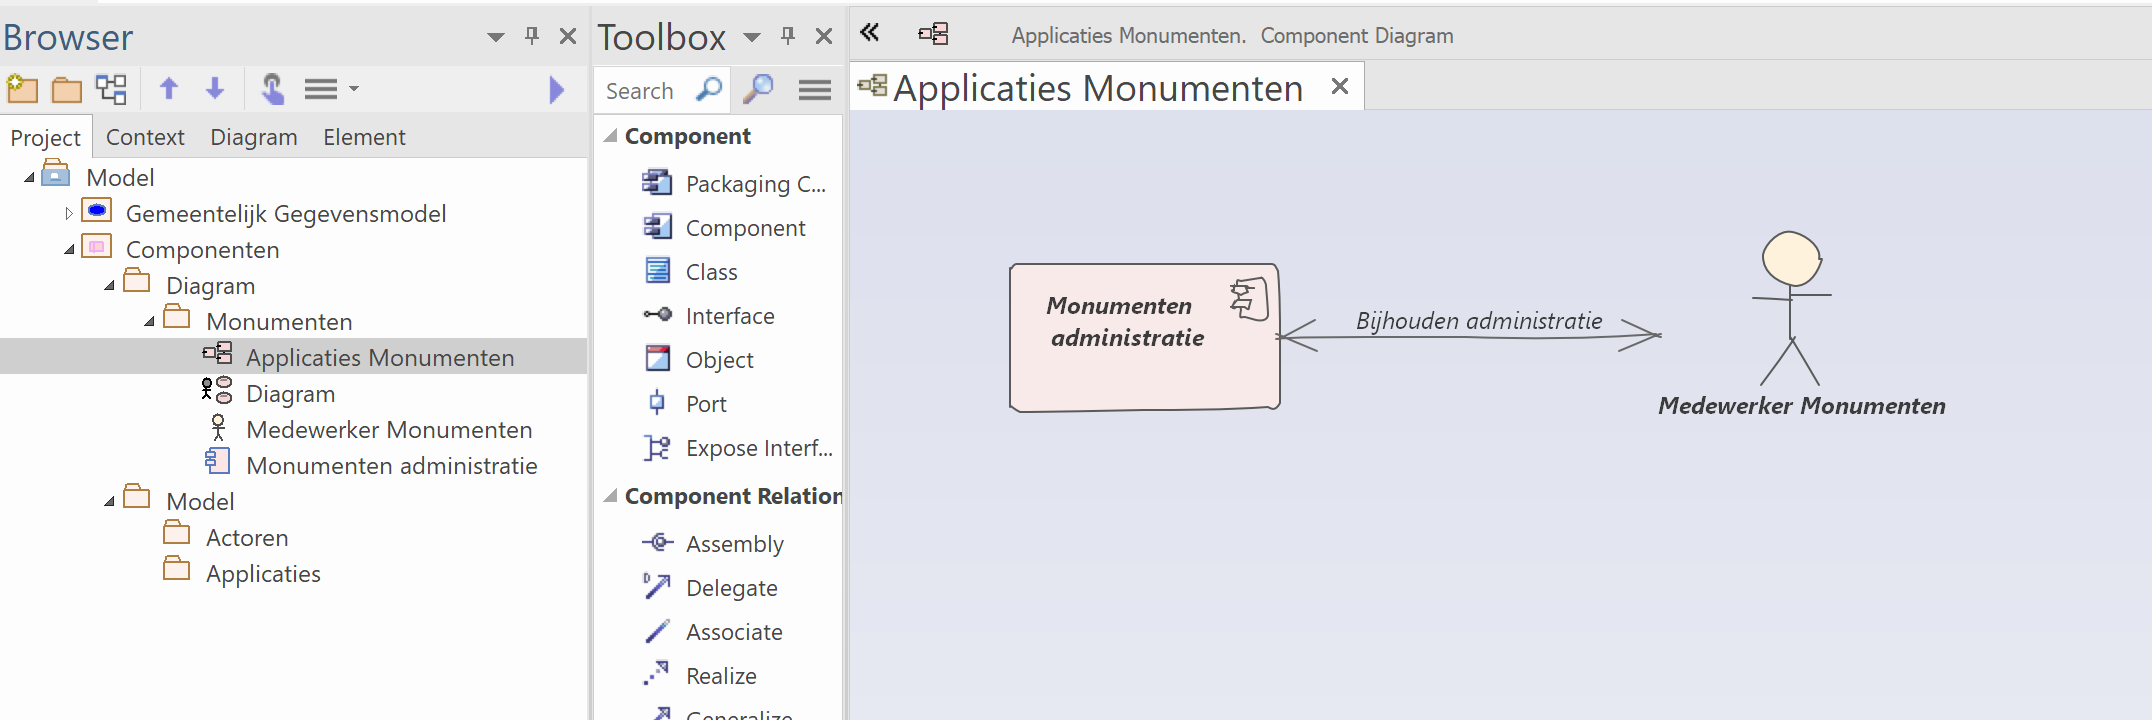
Screenshot: the example component diagram for Monuments.
6. Once finished, drag the components and actors into the previously created folders, so they can be reused for future models.
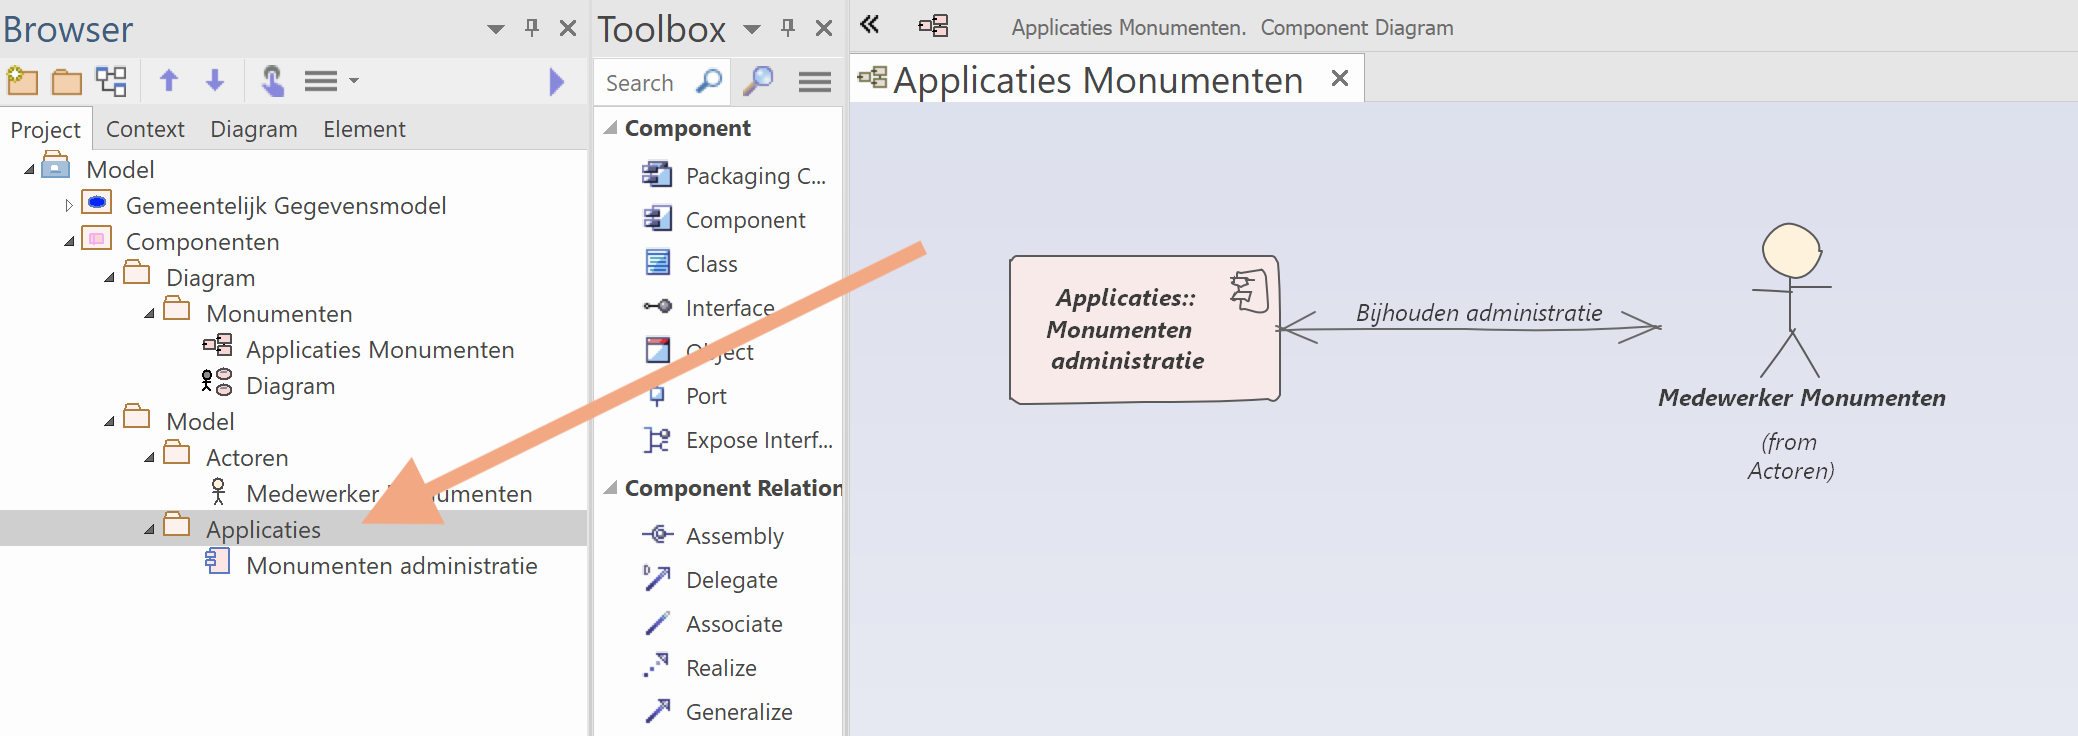
Screenshot: dragging components into folders for reuse.
7. Done — on to modelling the data in the application.
Modelling applications and data
When modelling applications and data you elaborate which data each application contains. You do this by placing data (in EA: objects) — based on the analysis results — onto the applications (in EA: components).
The steps are:
1. Create a new UML Structural Component diagram.
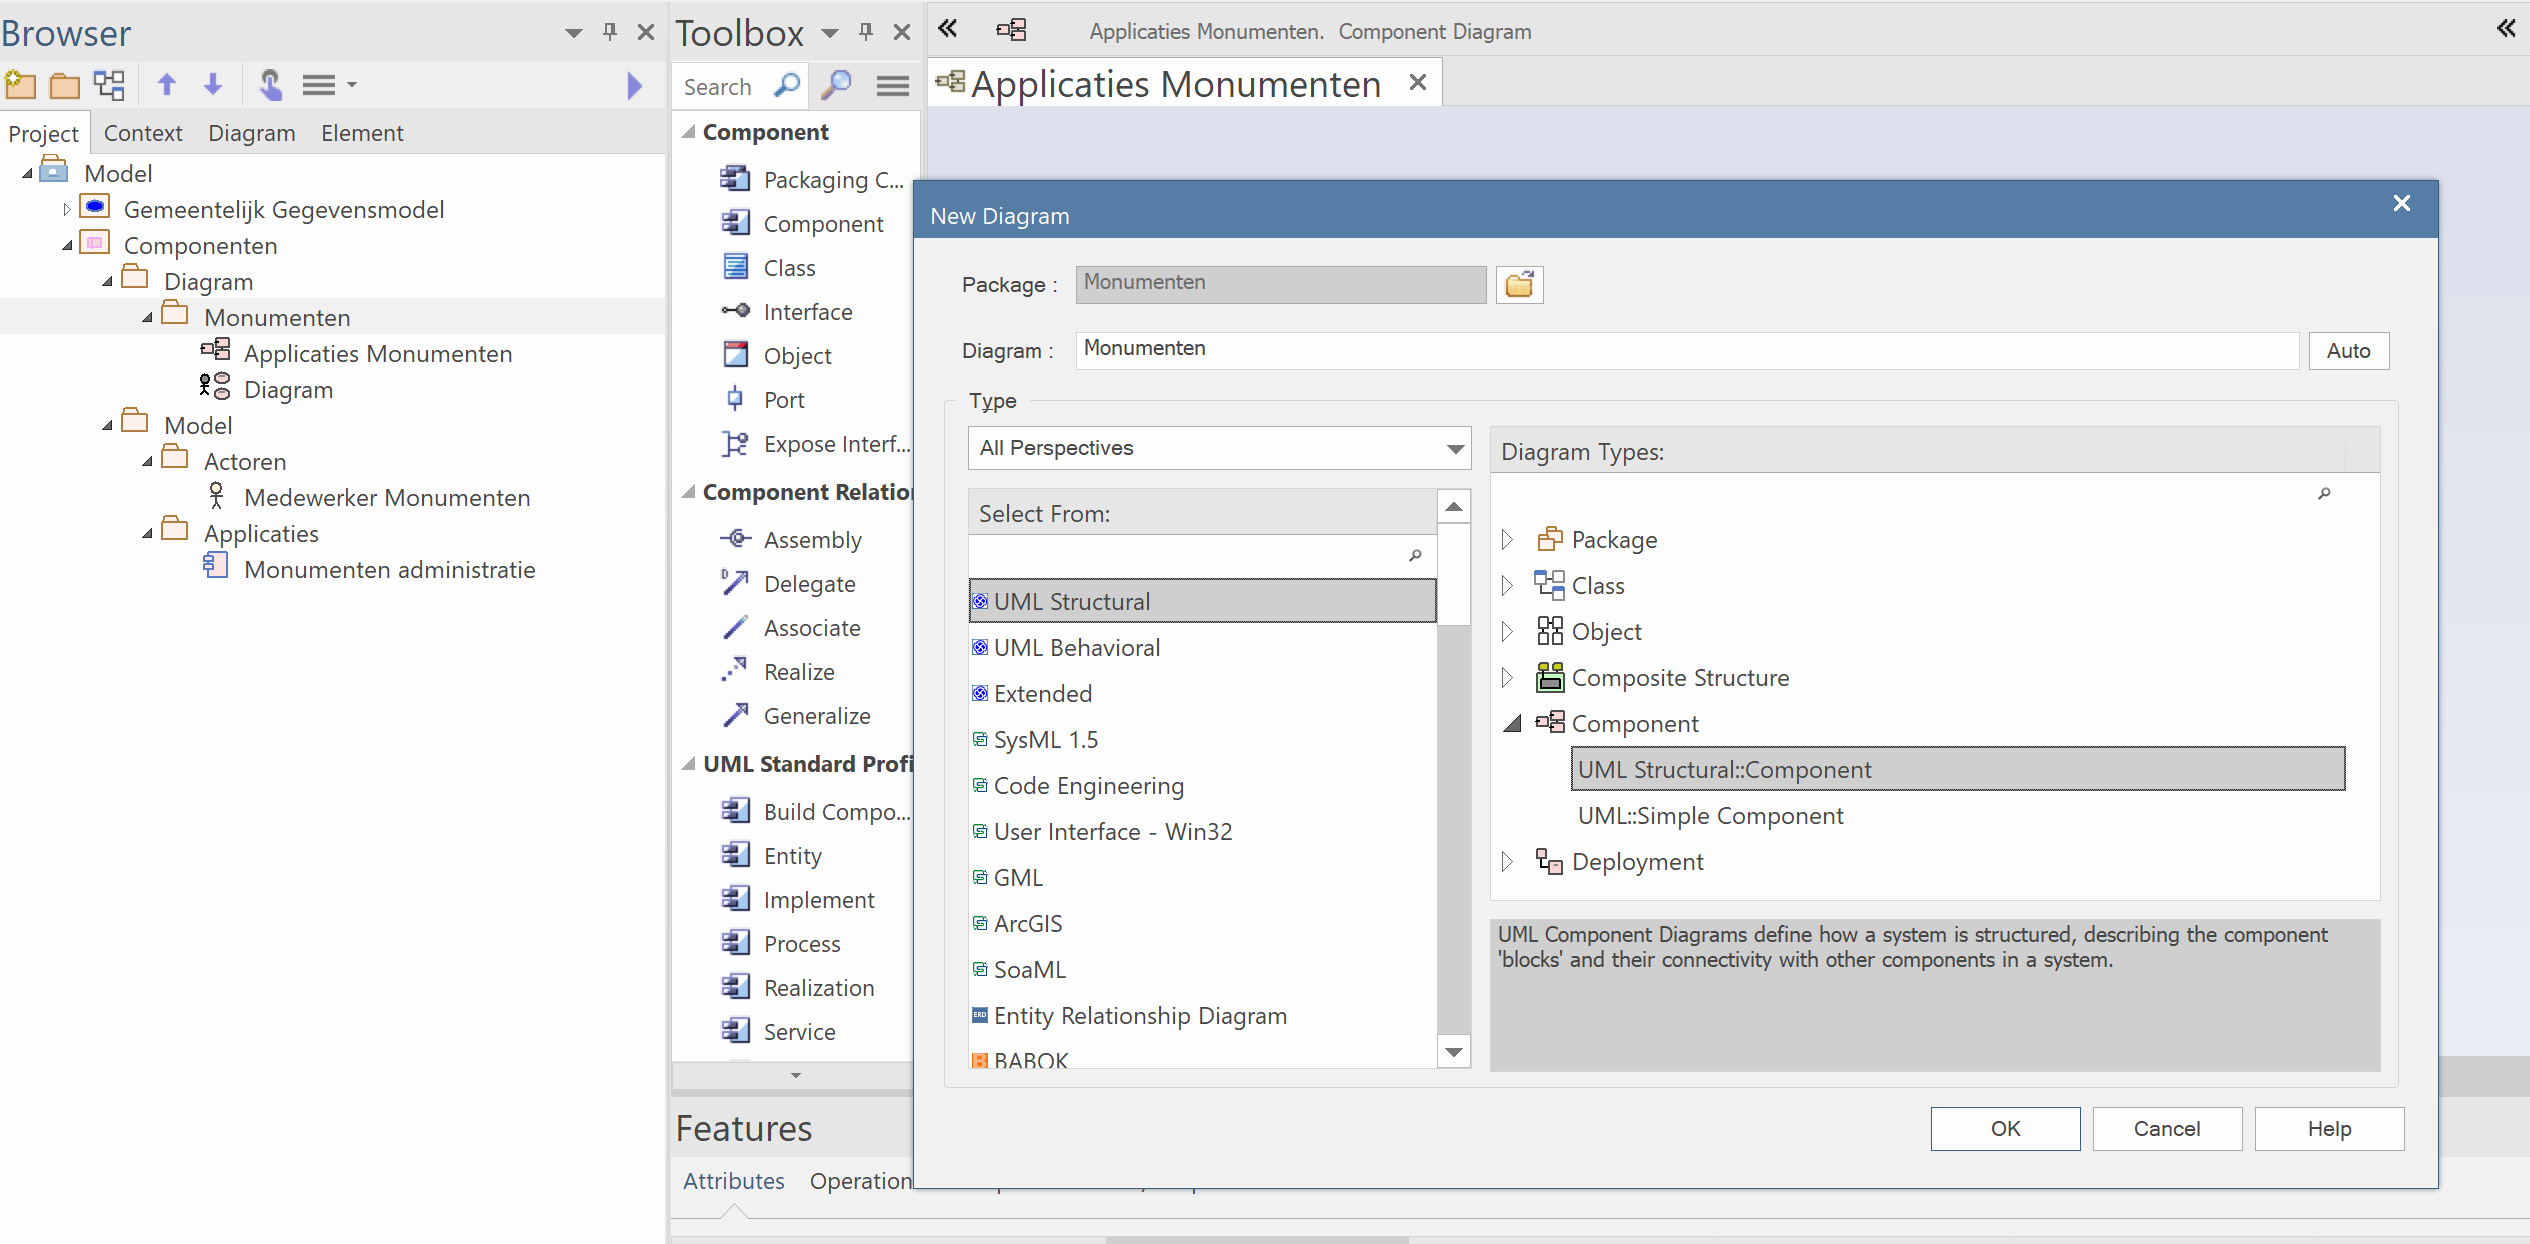
Screenshot: creating a UML Structural Component diagram.
2. Drag the previously created application onto it. In the example, the Monumentenadministratie application.
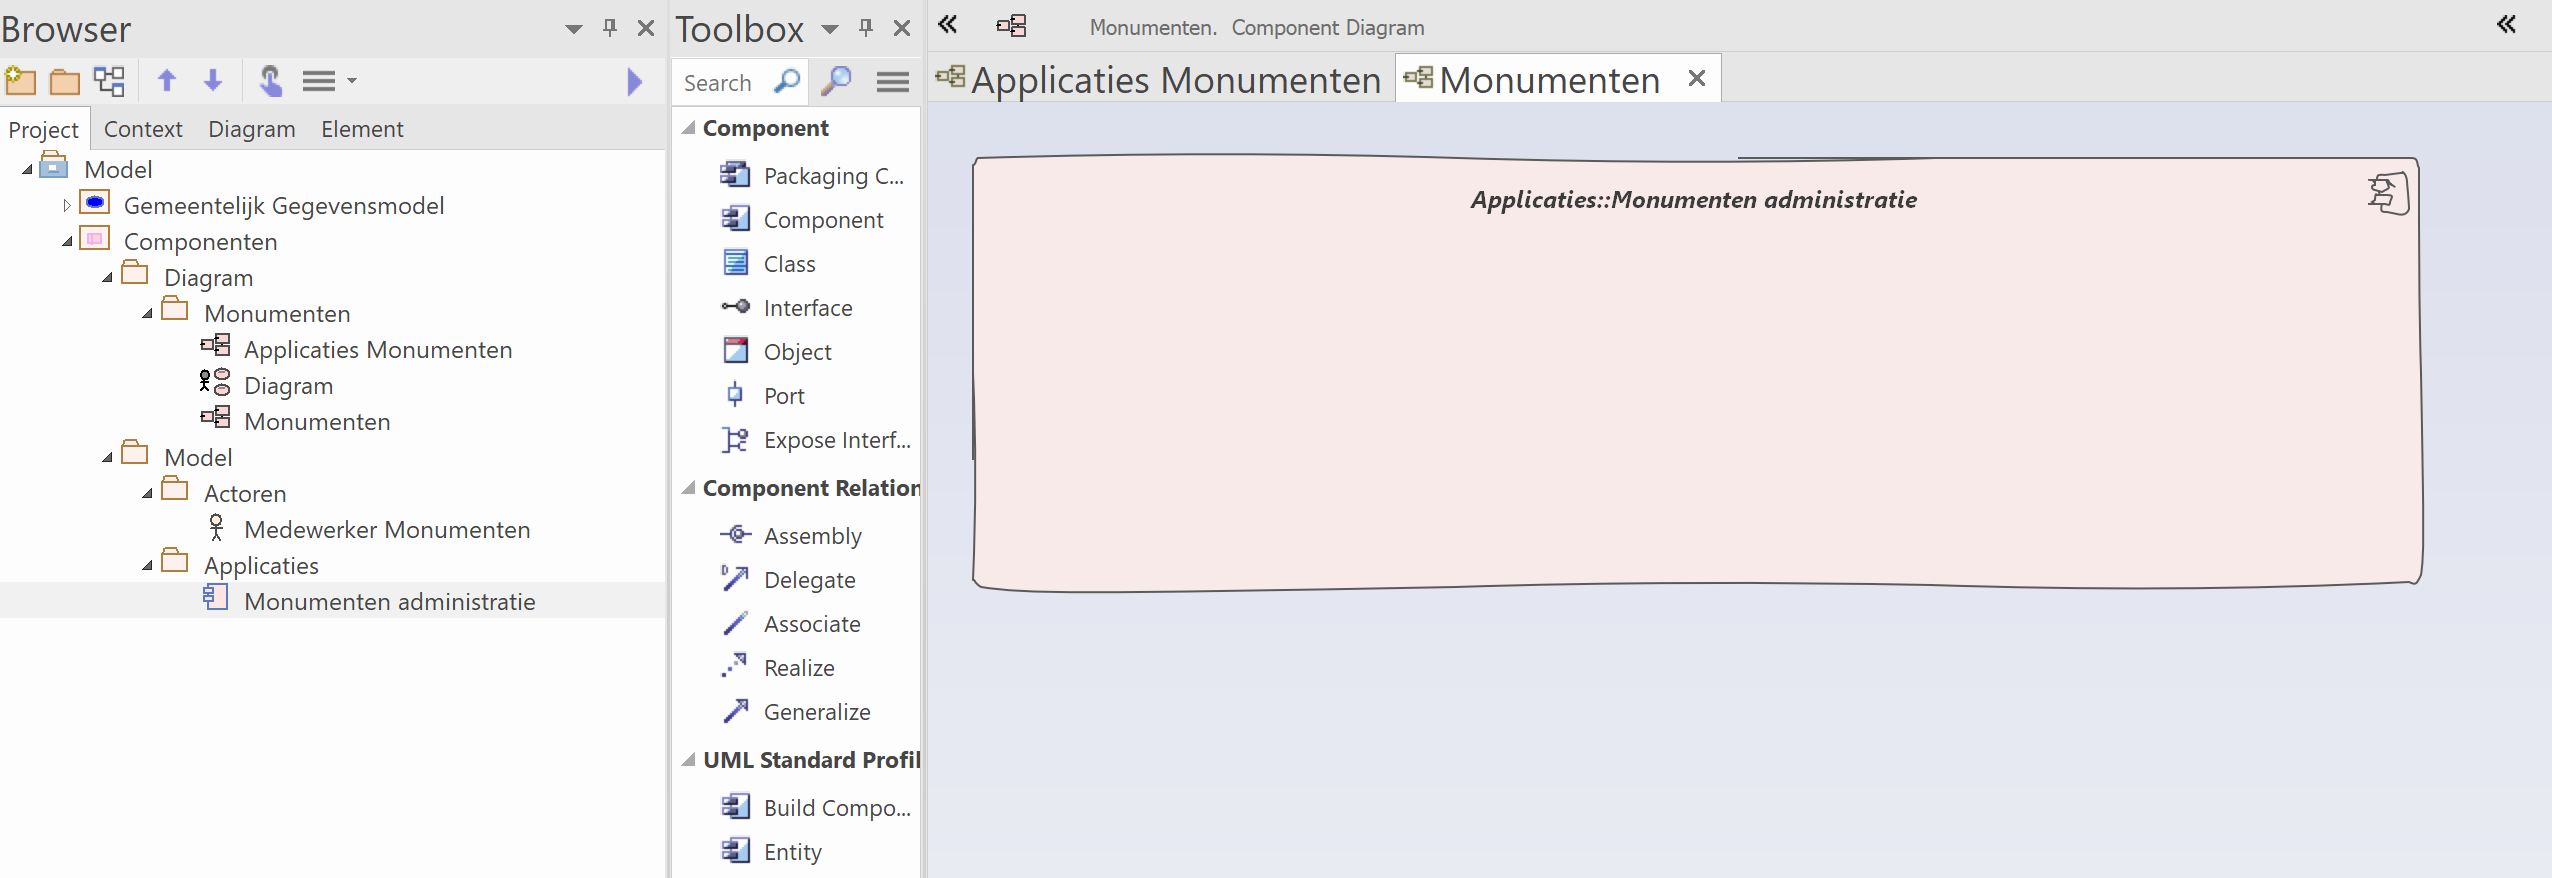
Screenshot: the application "Monumentenadministratie" placed on the diagram.
3. Drag an object onto the diagram for each kind of data and give them the right names. The example shows three kinds; in practice you will use more.
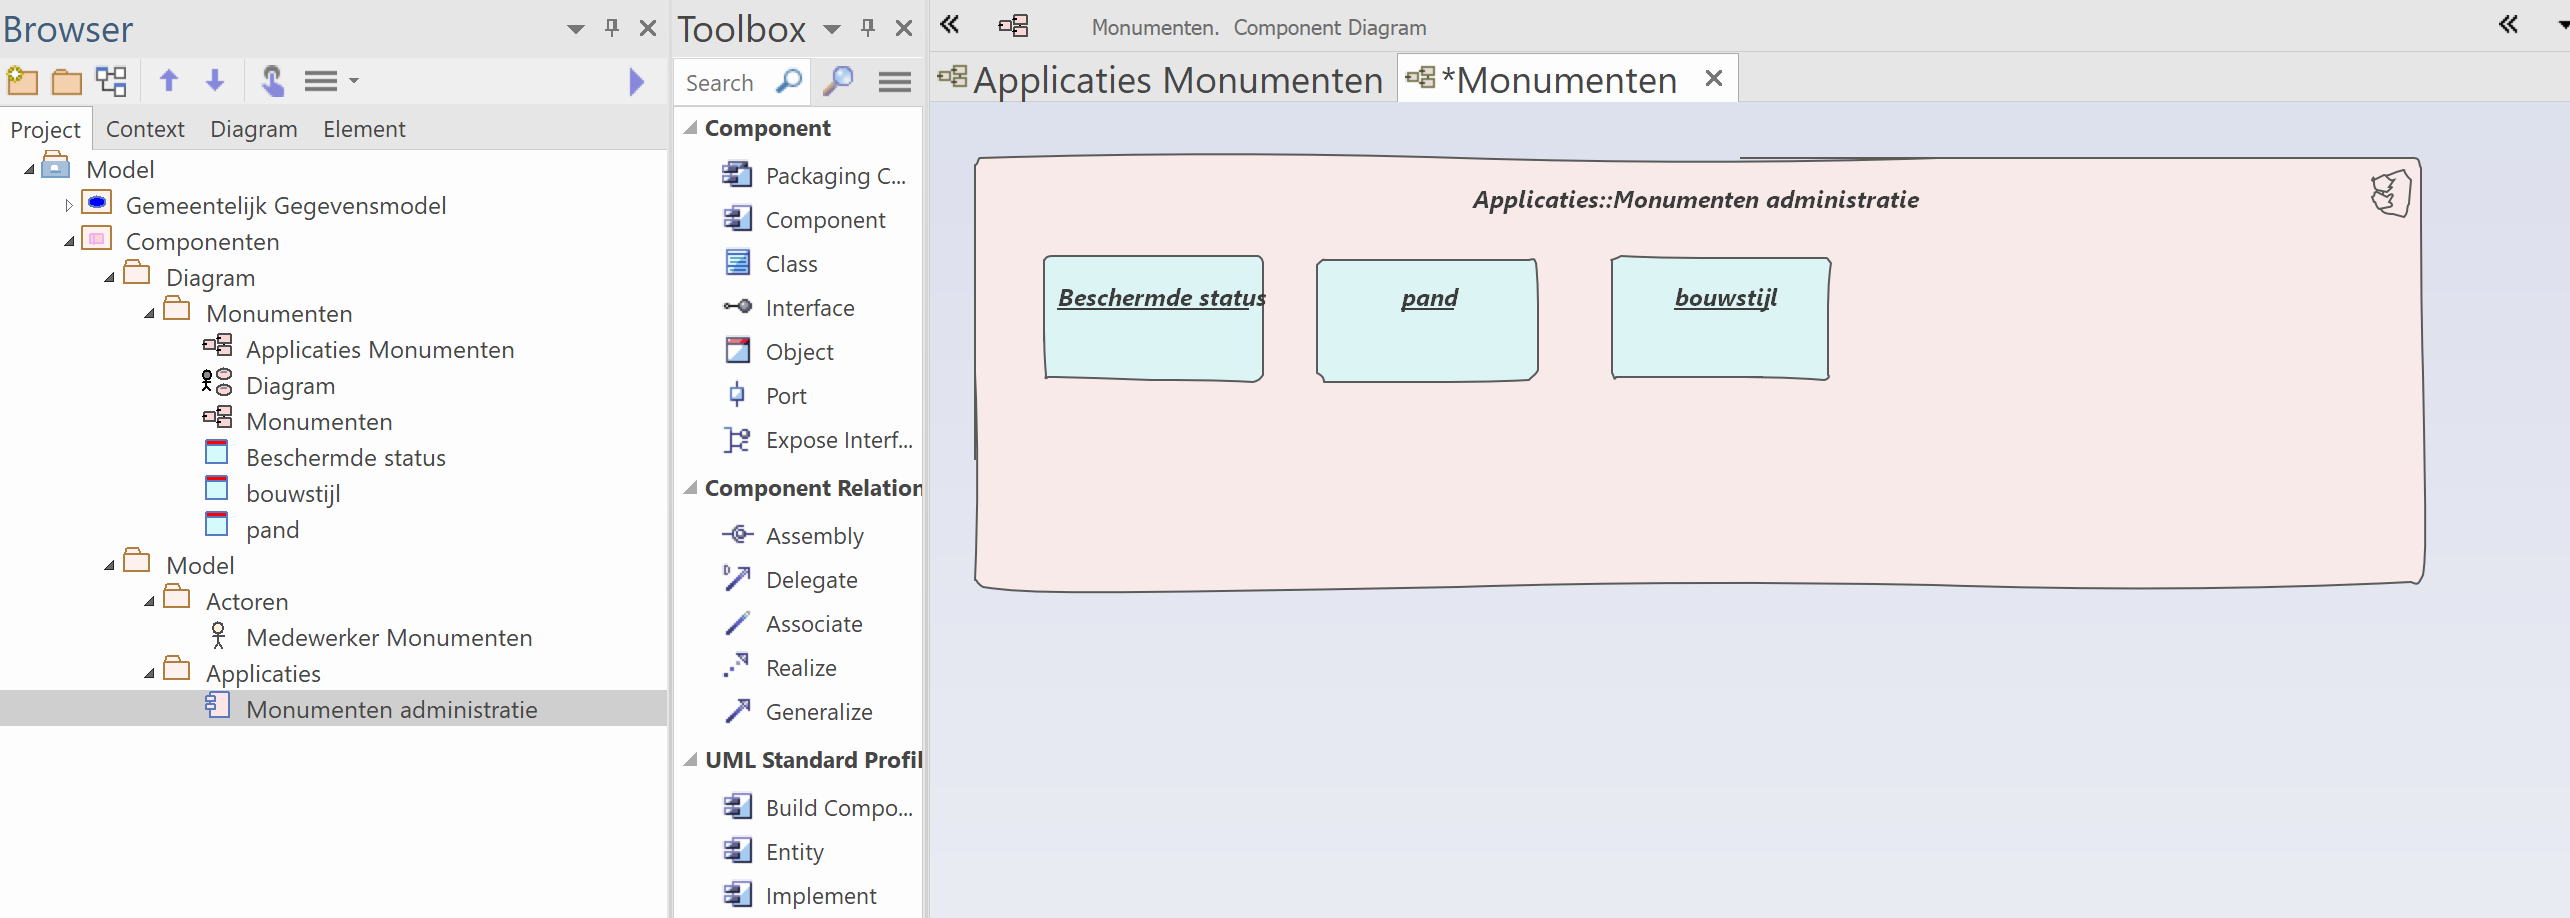
Screenshot: data objects added to the diagram.
4. Finally, drag the data objects onto the application component. This way you can later see, during further analysis, which data from which domains is held in an application — and produce reports about applications and their data.
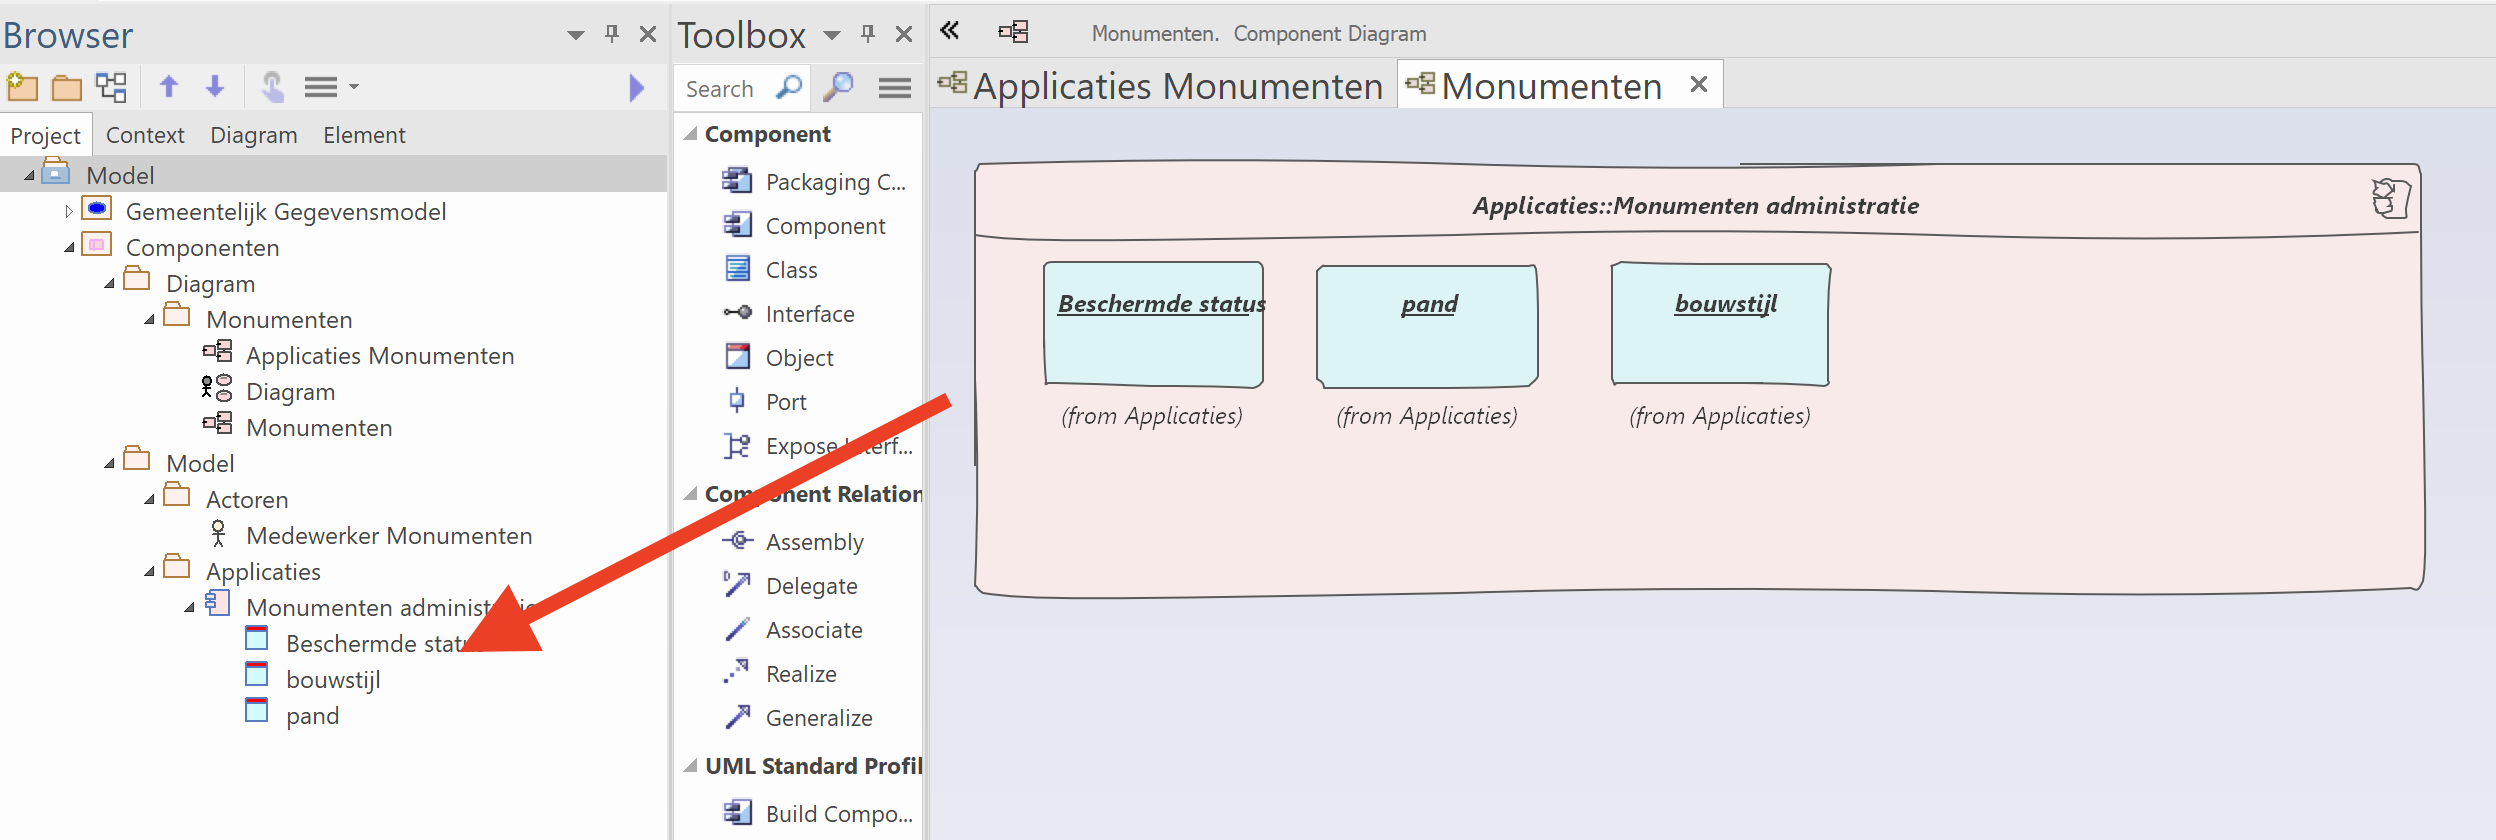
Screenshot: data objects placed inside the application component.
5. Done — on to the next step.
Extending the GGM
Once all relevant data has been found, you can move to the next step: creating new object types and relating data to existing object types. Pay close attention to what the code-generation templates allow, so you do not get into trouble later when transforming to tables.
The extension proceeds in several steps:
1. Open the GGM and create a folder for the part you are elaborating. In the example: Erfgoed: Voorbeeld (Heritage: Example). Under that folder, create two more: Diagram and Model Voorbeeld. This is where the object types will live.
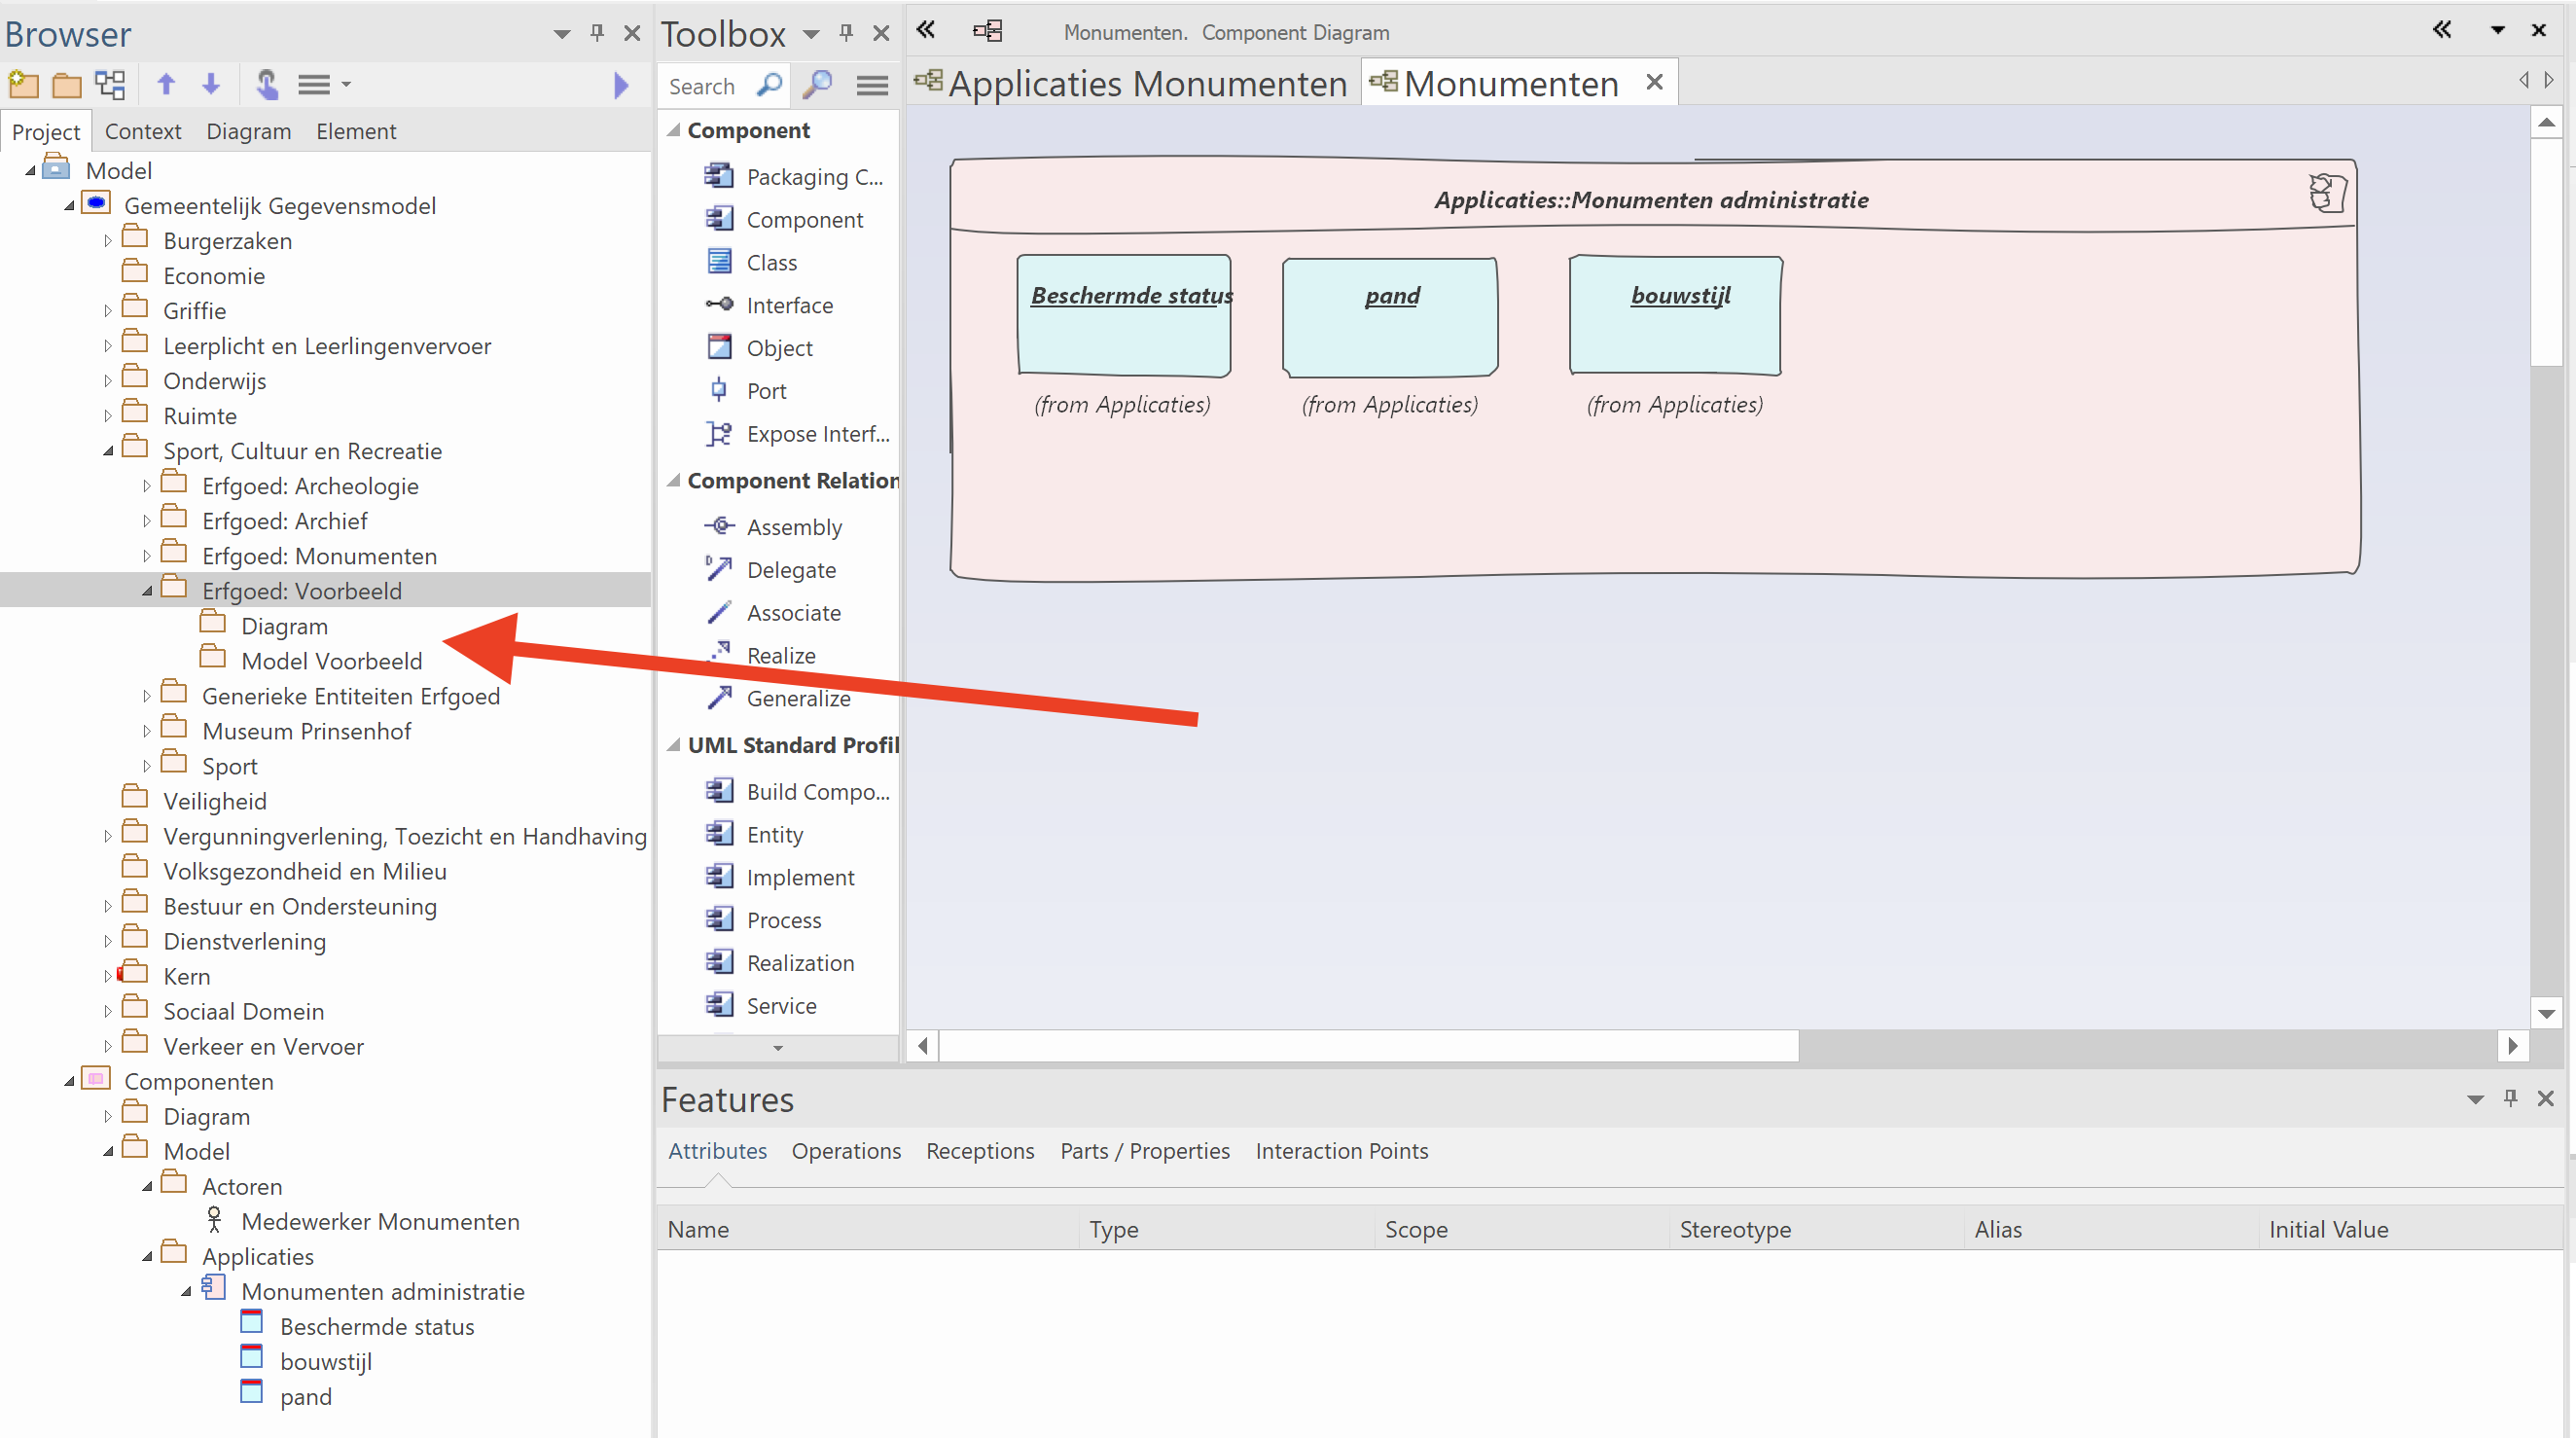
Screenshot: the new folder for the example elaboration.
2. Create a class for one of the data kinds found, and drag it into Model Voorbeeld. You only do this once, because the Model Voorbeeld folder remains hidden afterwards.
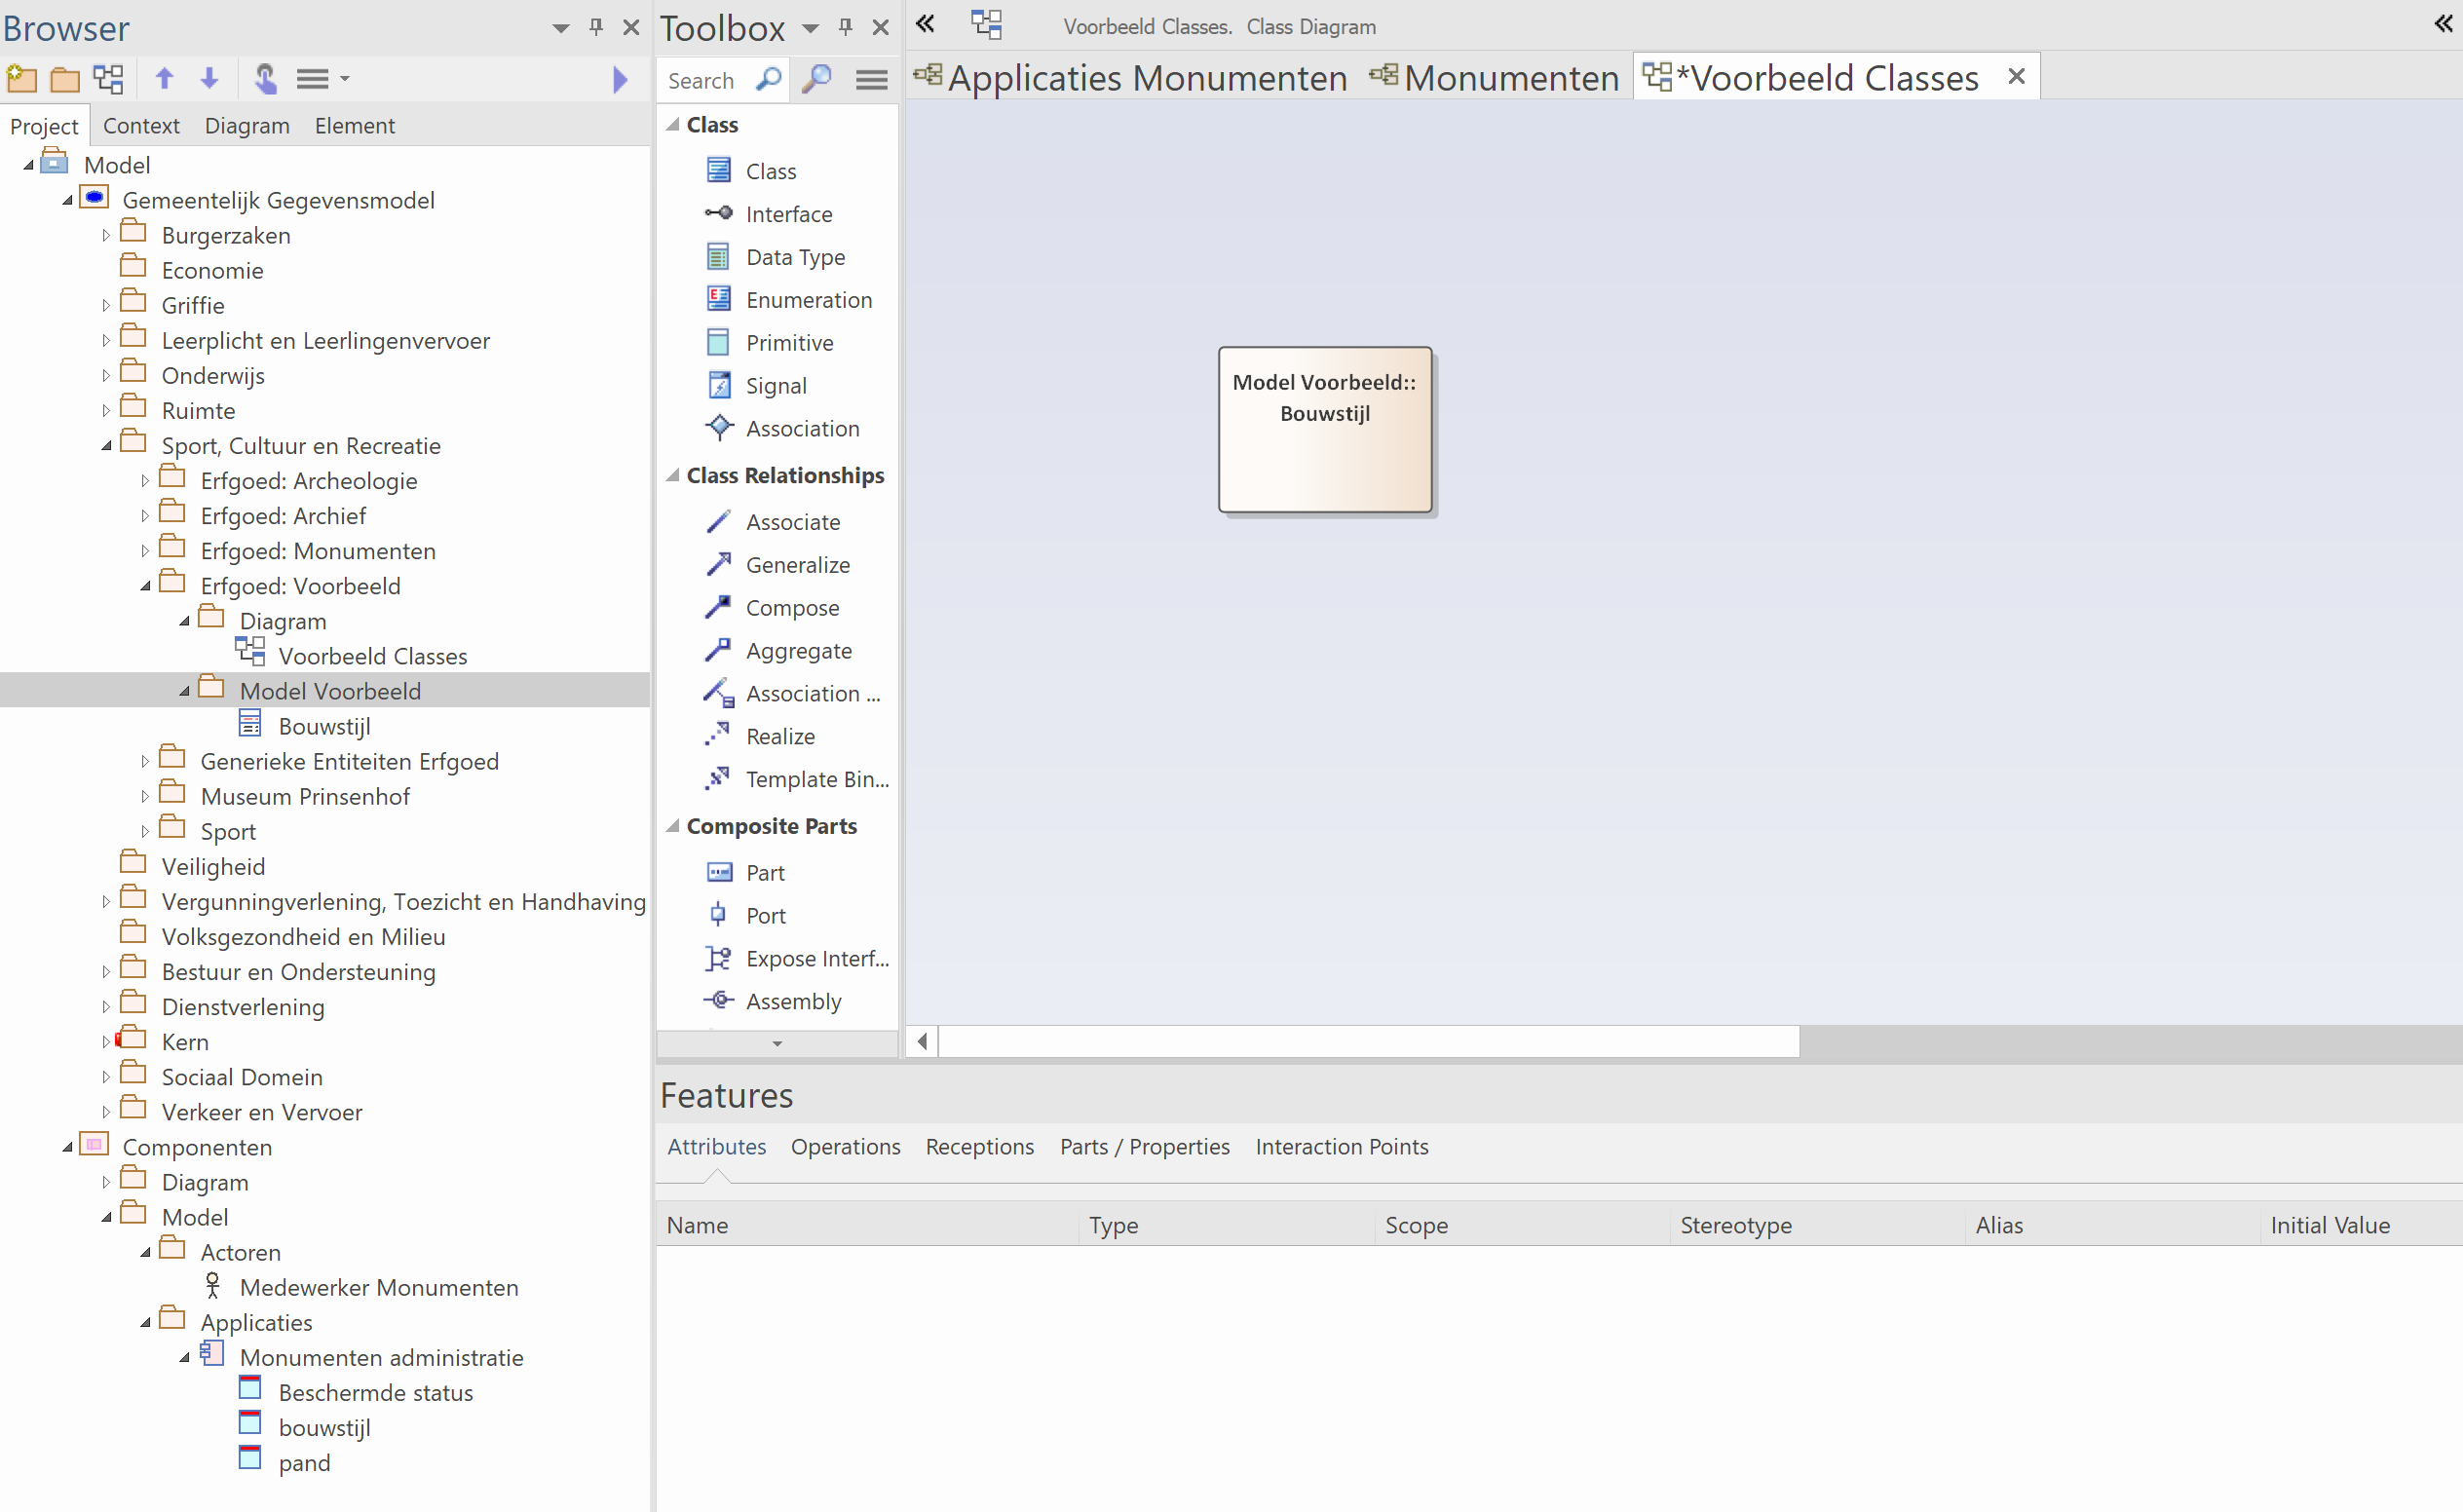
Screenshot: the first class created and dragged into the model folder.
2b. To keep the class diagram tidy, you can disable showing class details such as attributes and methods. Double-click the diagram and untick these options in the Properties.
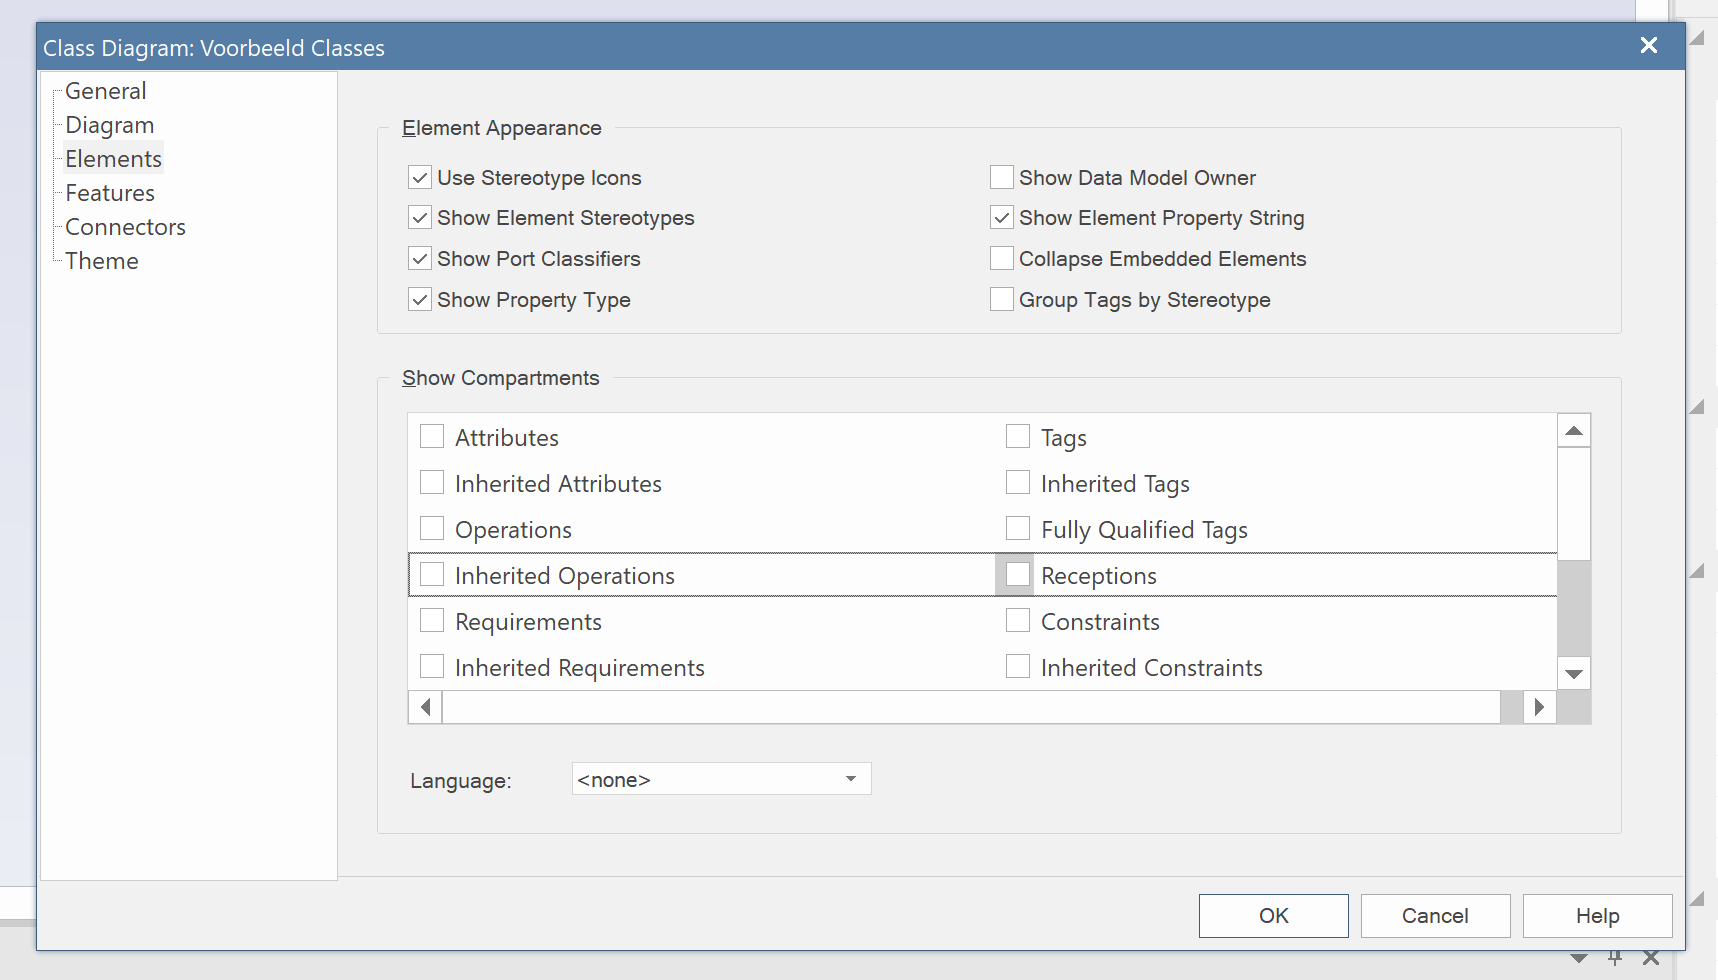
Screenshot (in Dutch / Enterprise Architect UI): Properties dialog with class-detail display disabled.
3. Select the just-created object type and press Ctrl-L to create a Classifier for this data kind. Navigate to the just-created folder, select the object type and press OK.
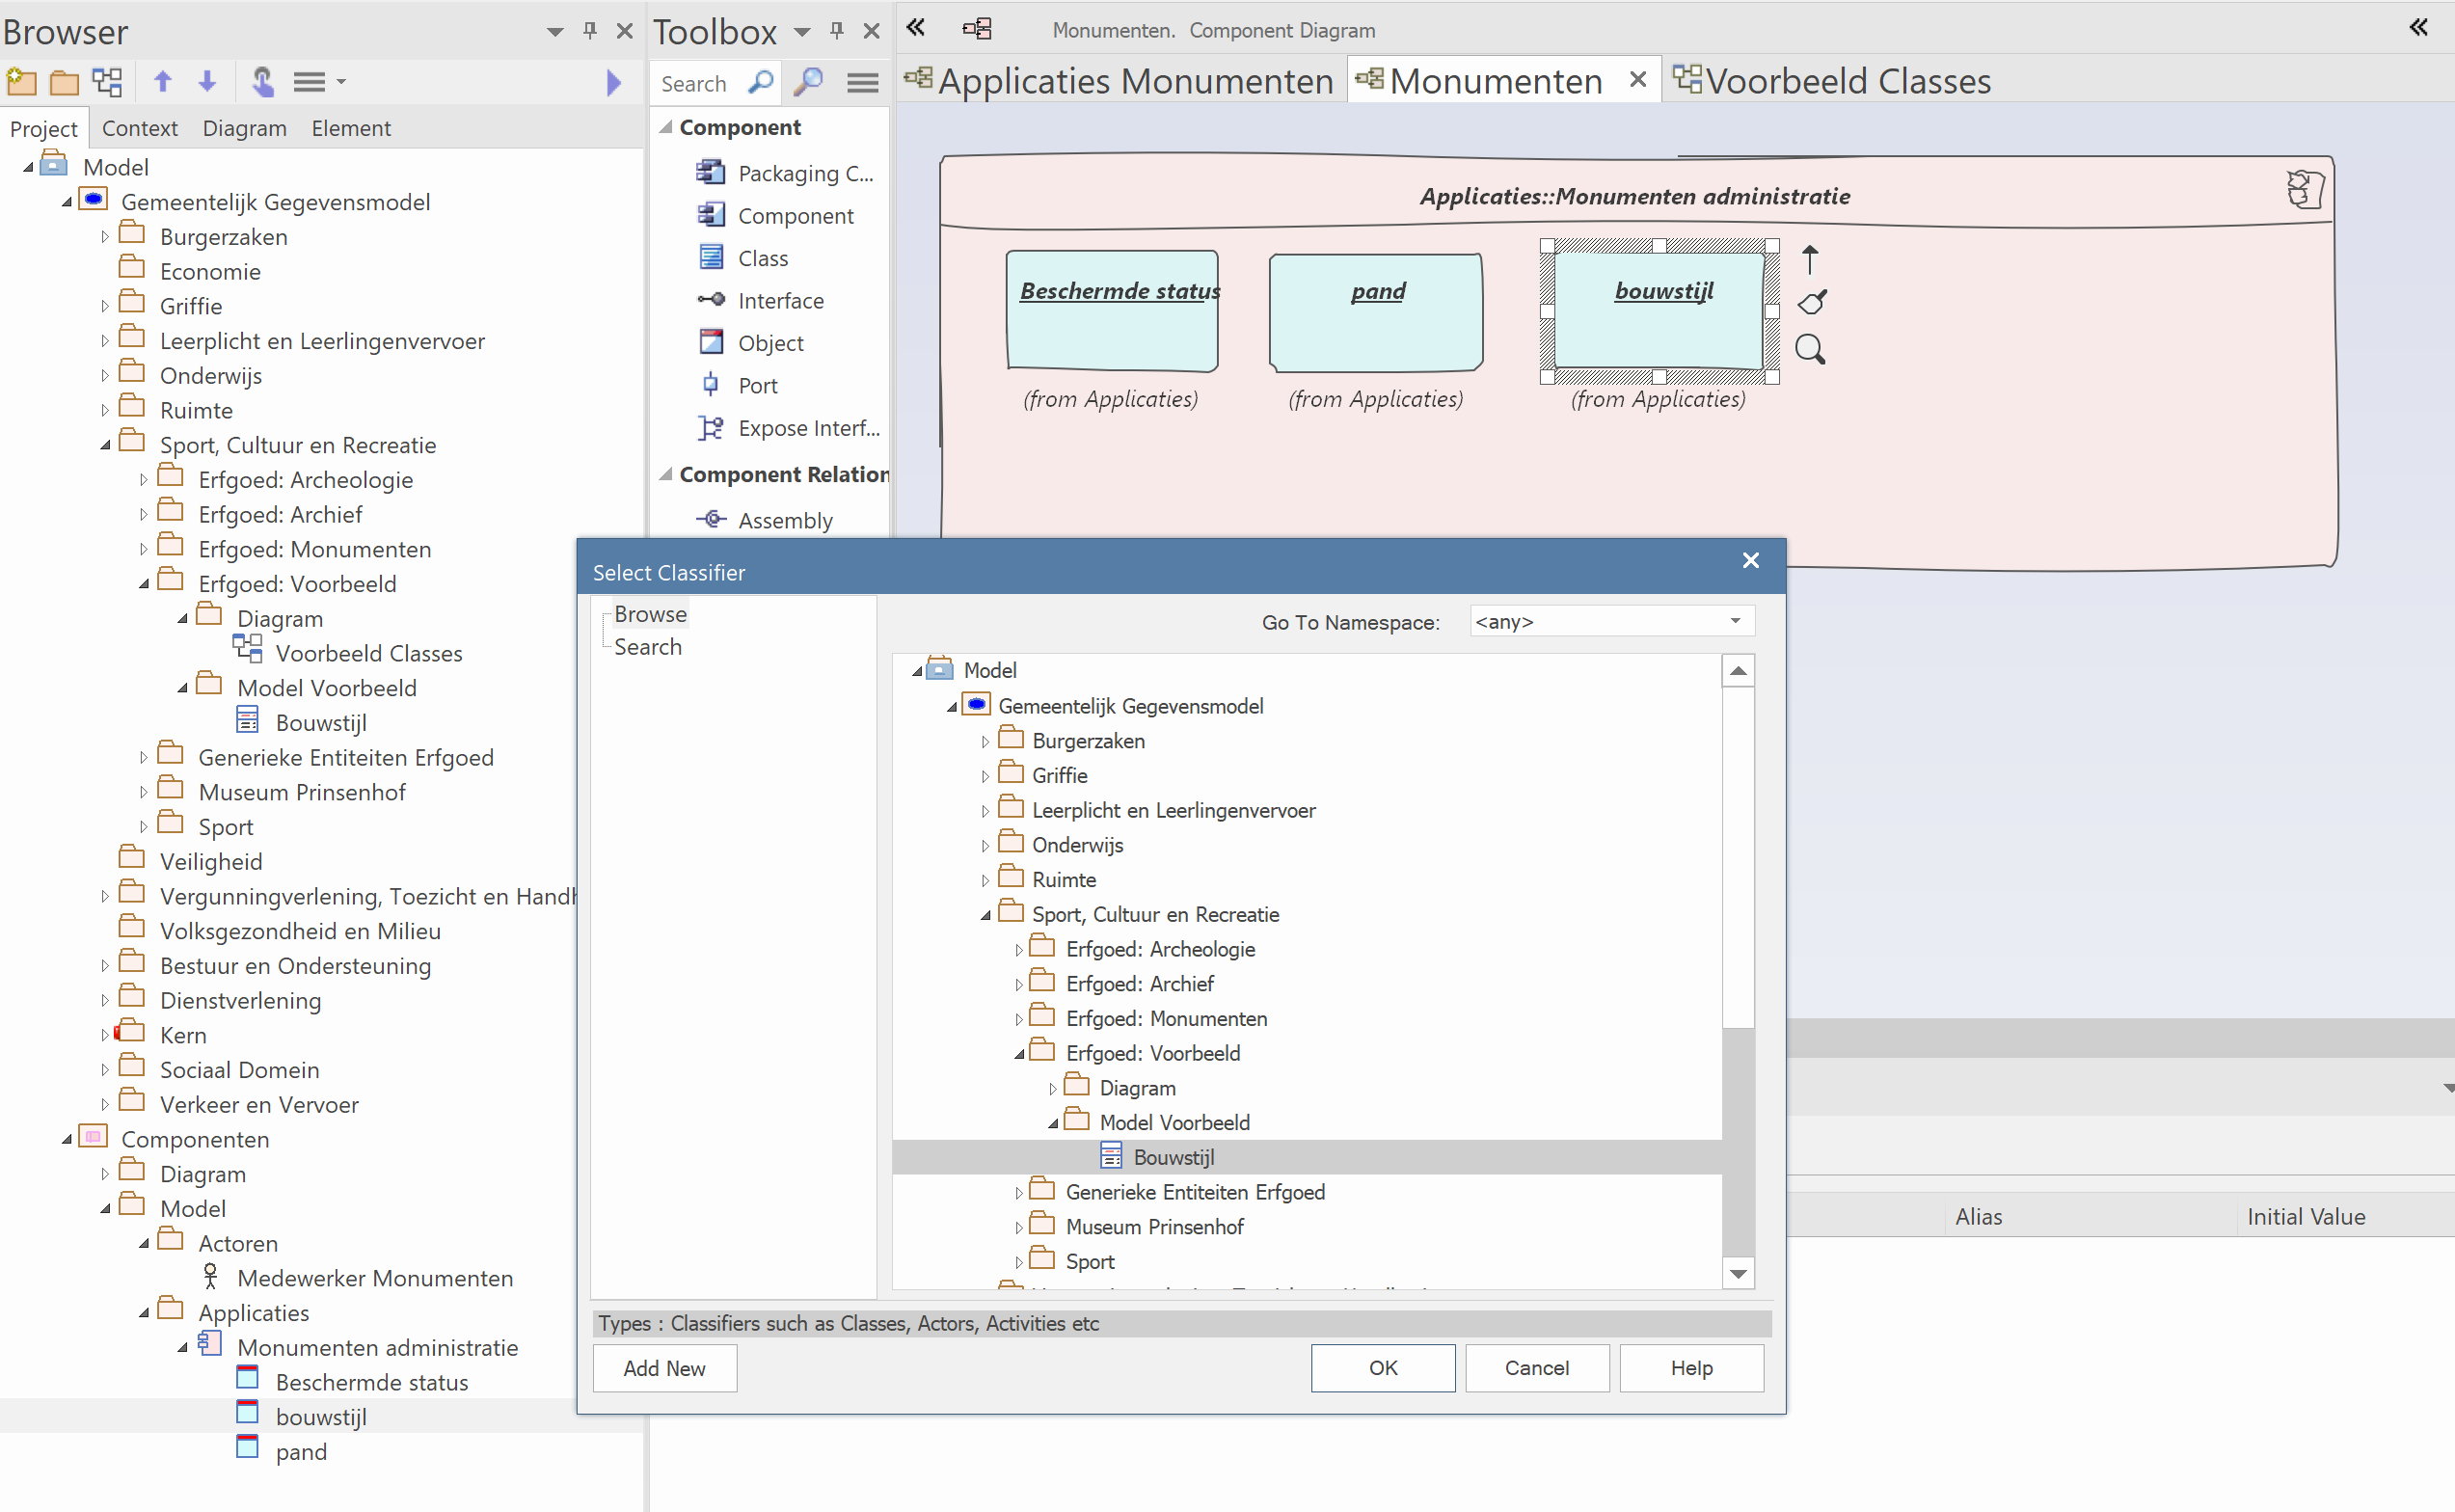
Screenshot: the Classifier dialog.
4a. Now continue with the modelling process. Repeat for all object types you want to elaborate. Select the object type, press Ctrl-L to create a Classifier, navigate to the folder, and either pick the object type or click Add New and type the new name, then press OK.
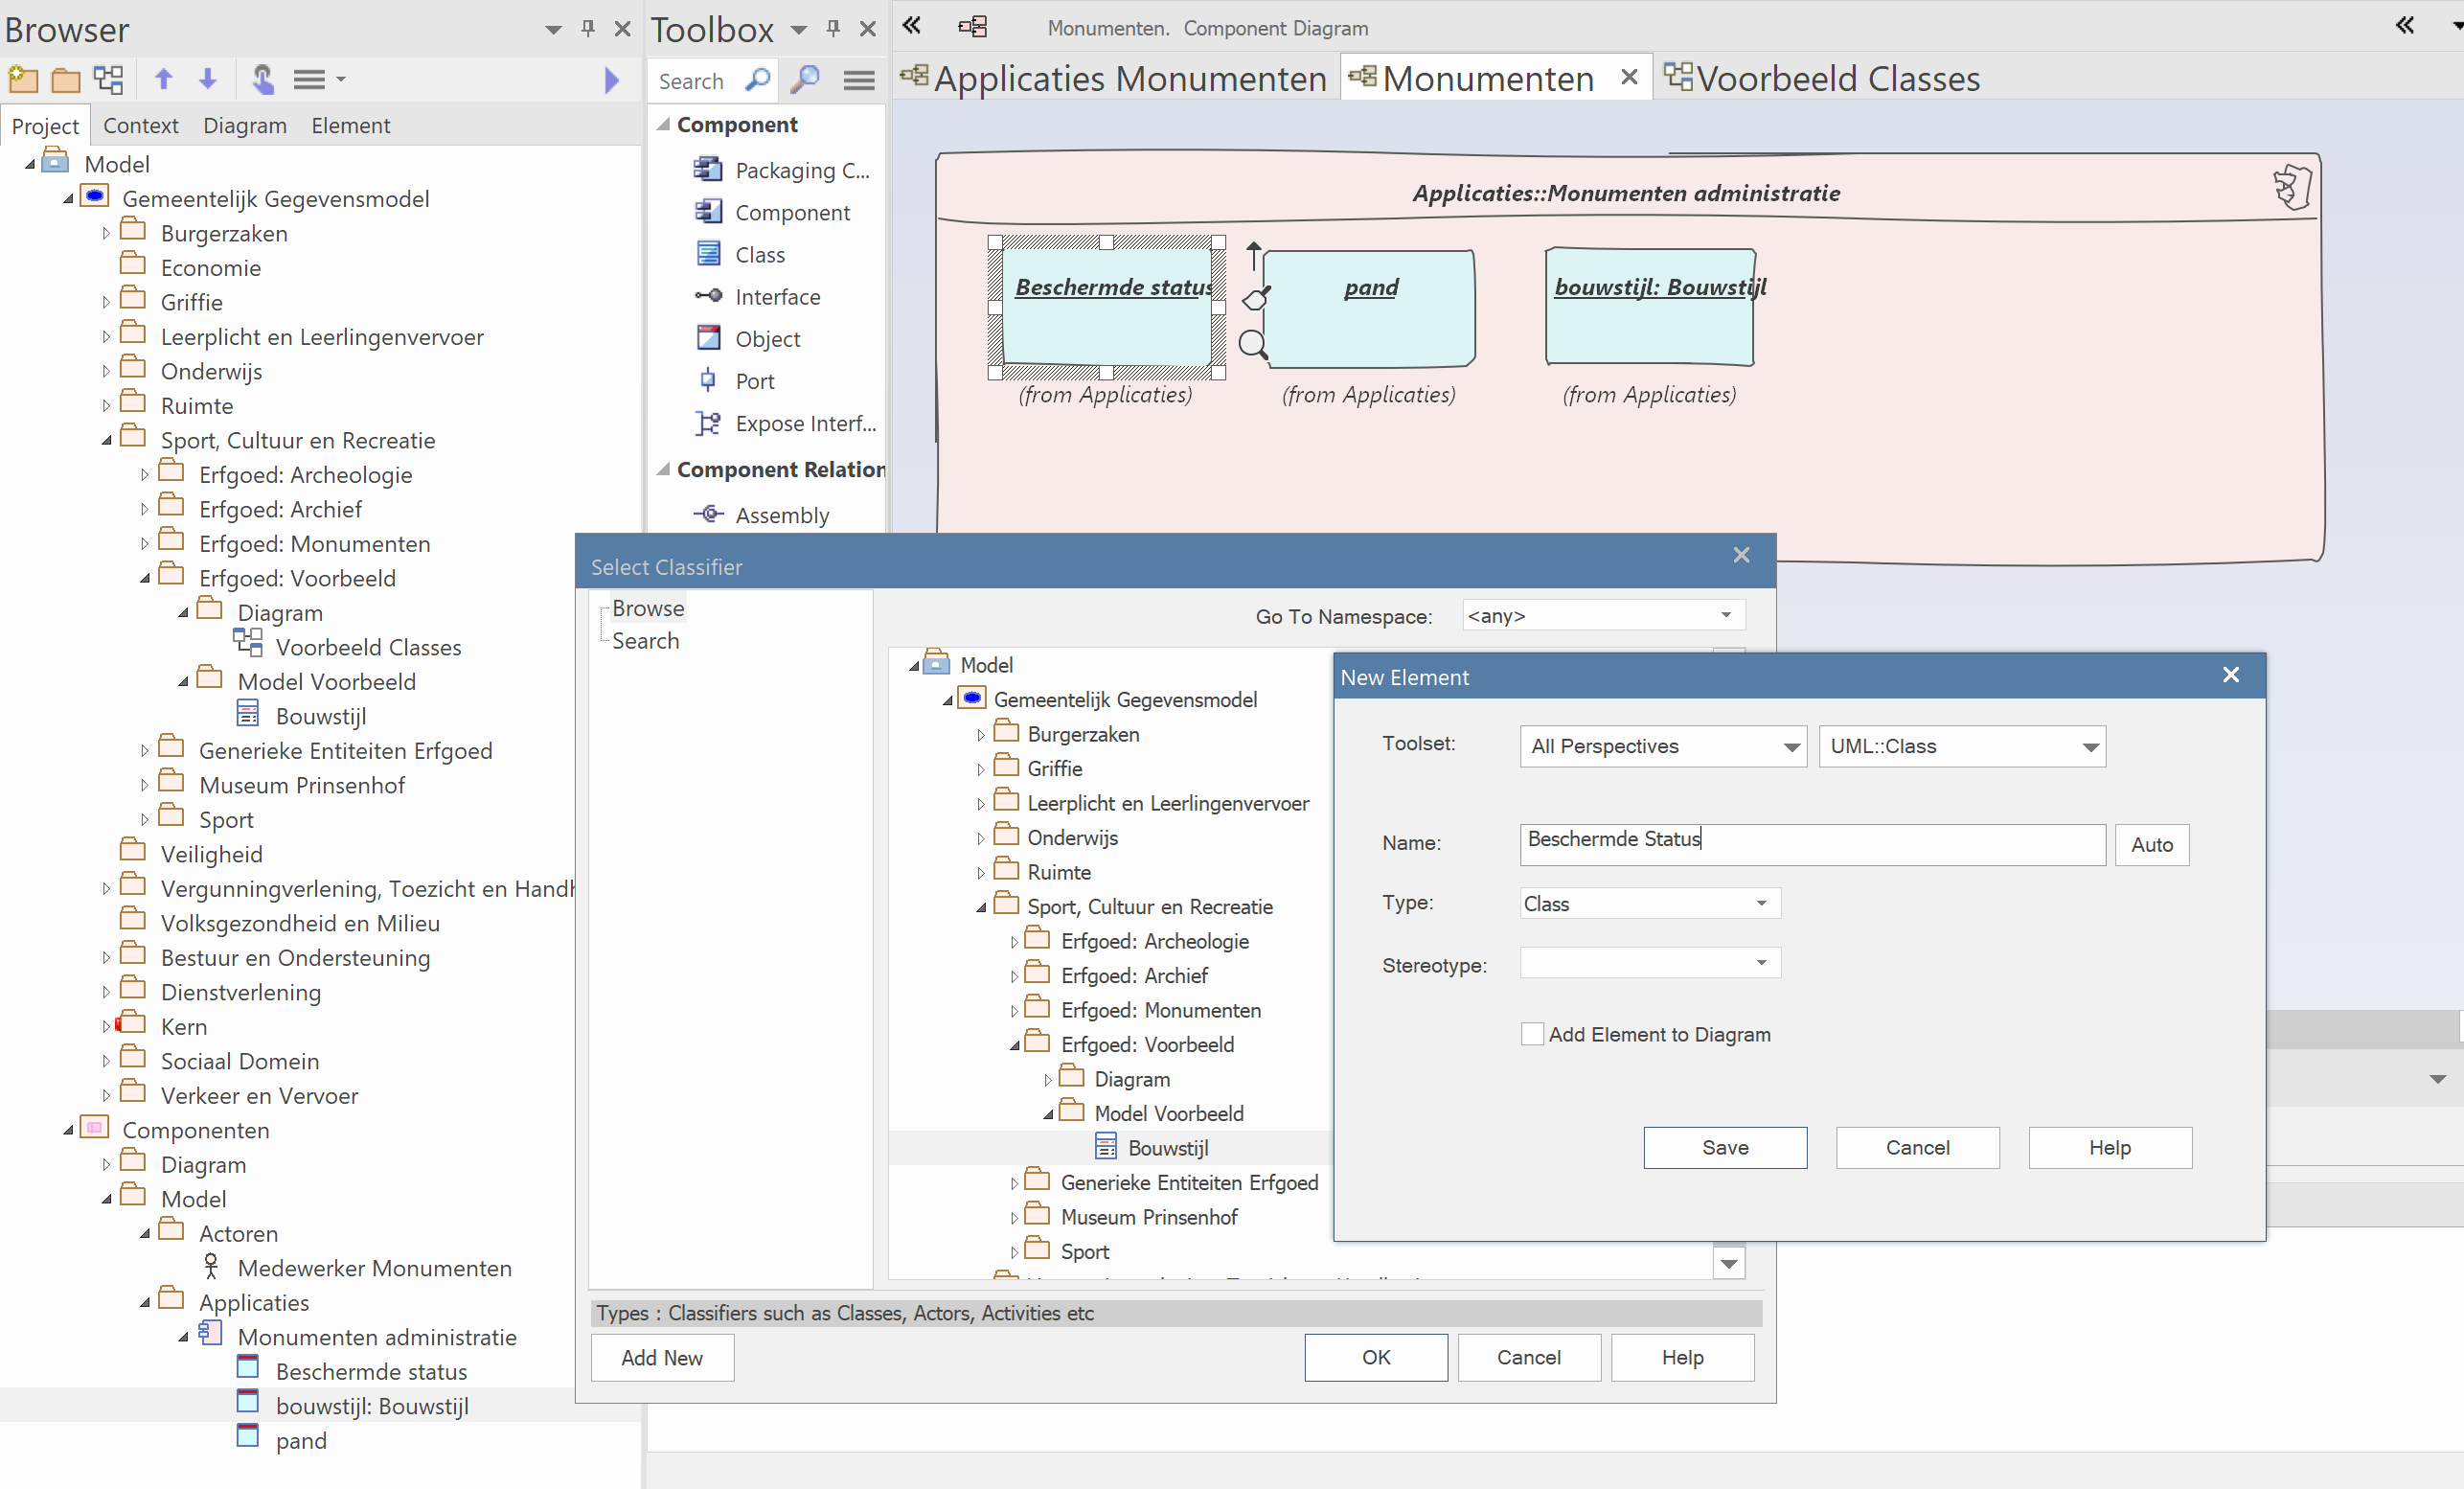
Screenshot: choosing or adding a Classifier.
4b. You can also create a Classifier pointing to an existing object type. In the example, Pand (Building). Press Ctrl-L again and navigate in the GGM to the intended object type — in the example, PAND in RSGBPlus.
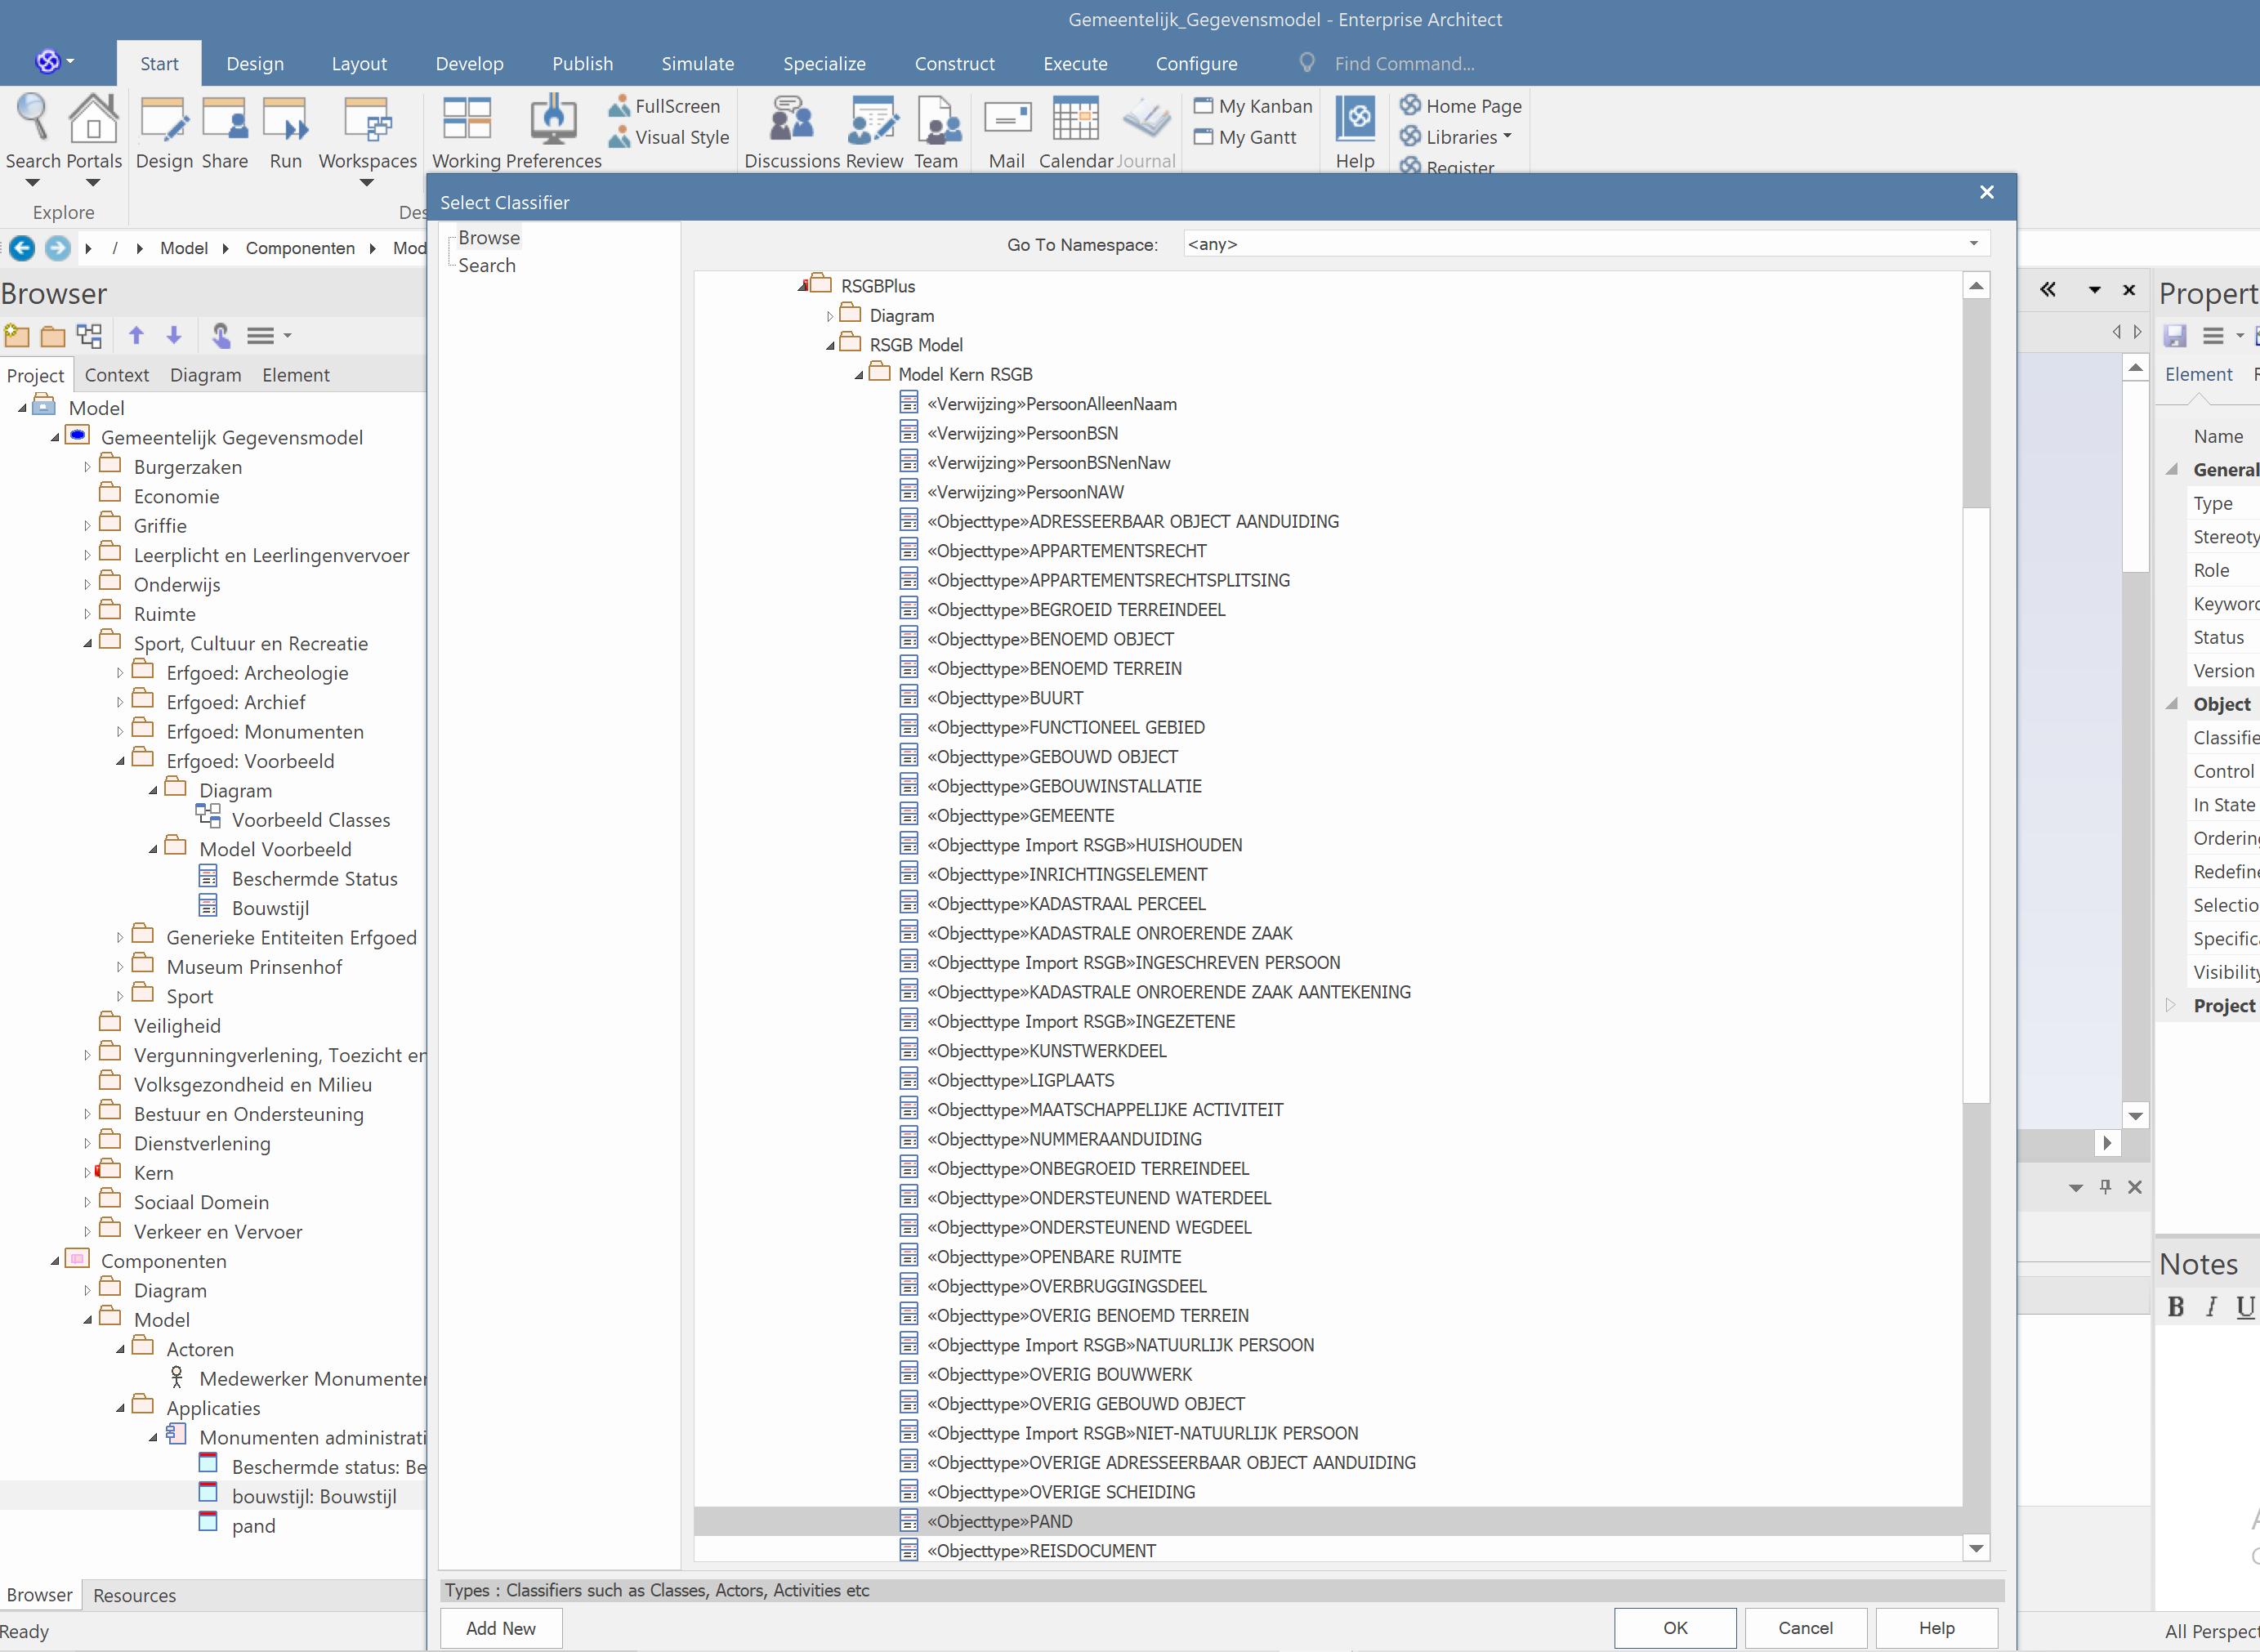
Screenshot: navigating to an existing object type in RSGBPlus.
5. Once all object types are complete, continue with the class diagram. Drag the various object types onto it.
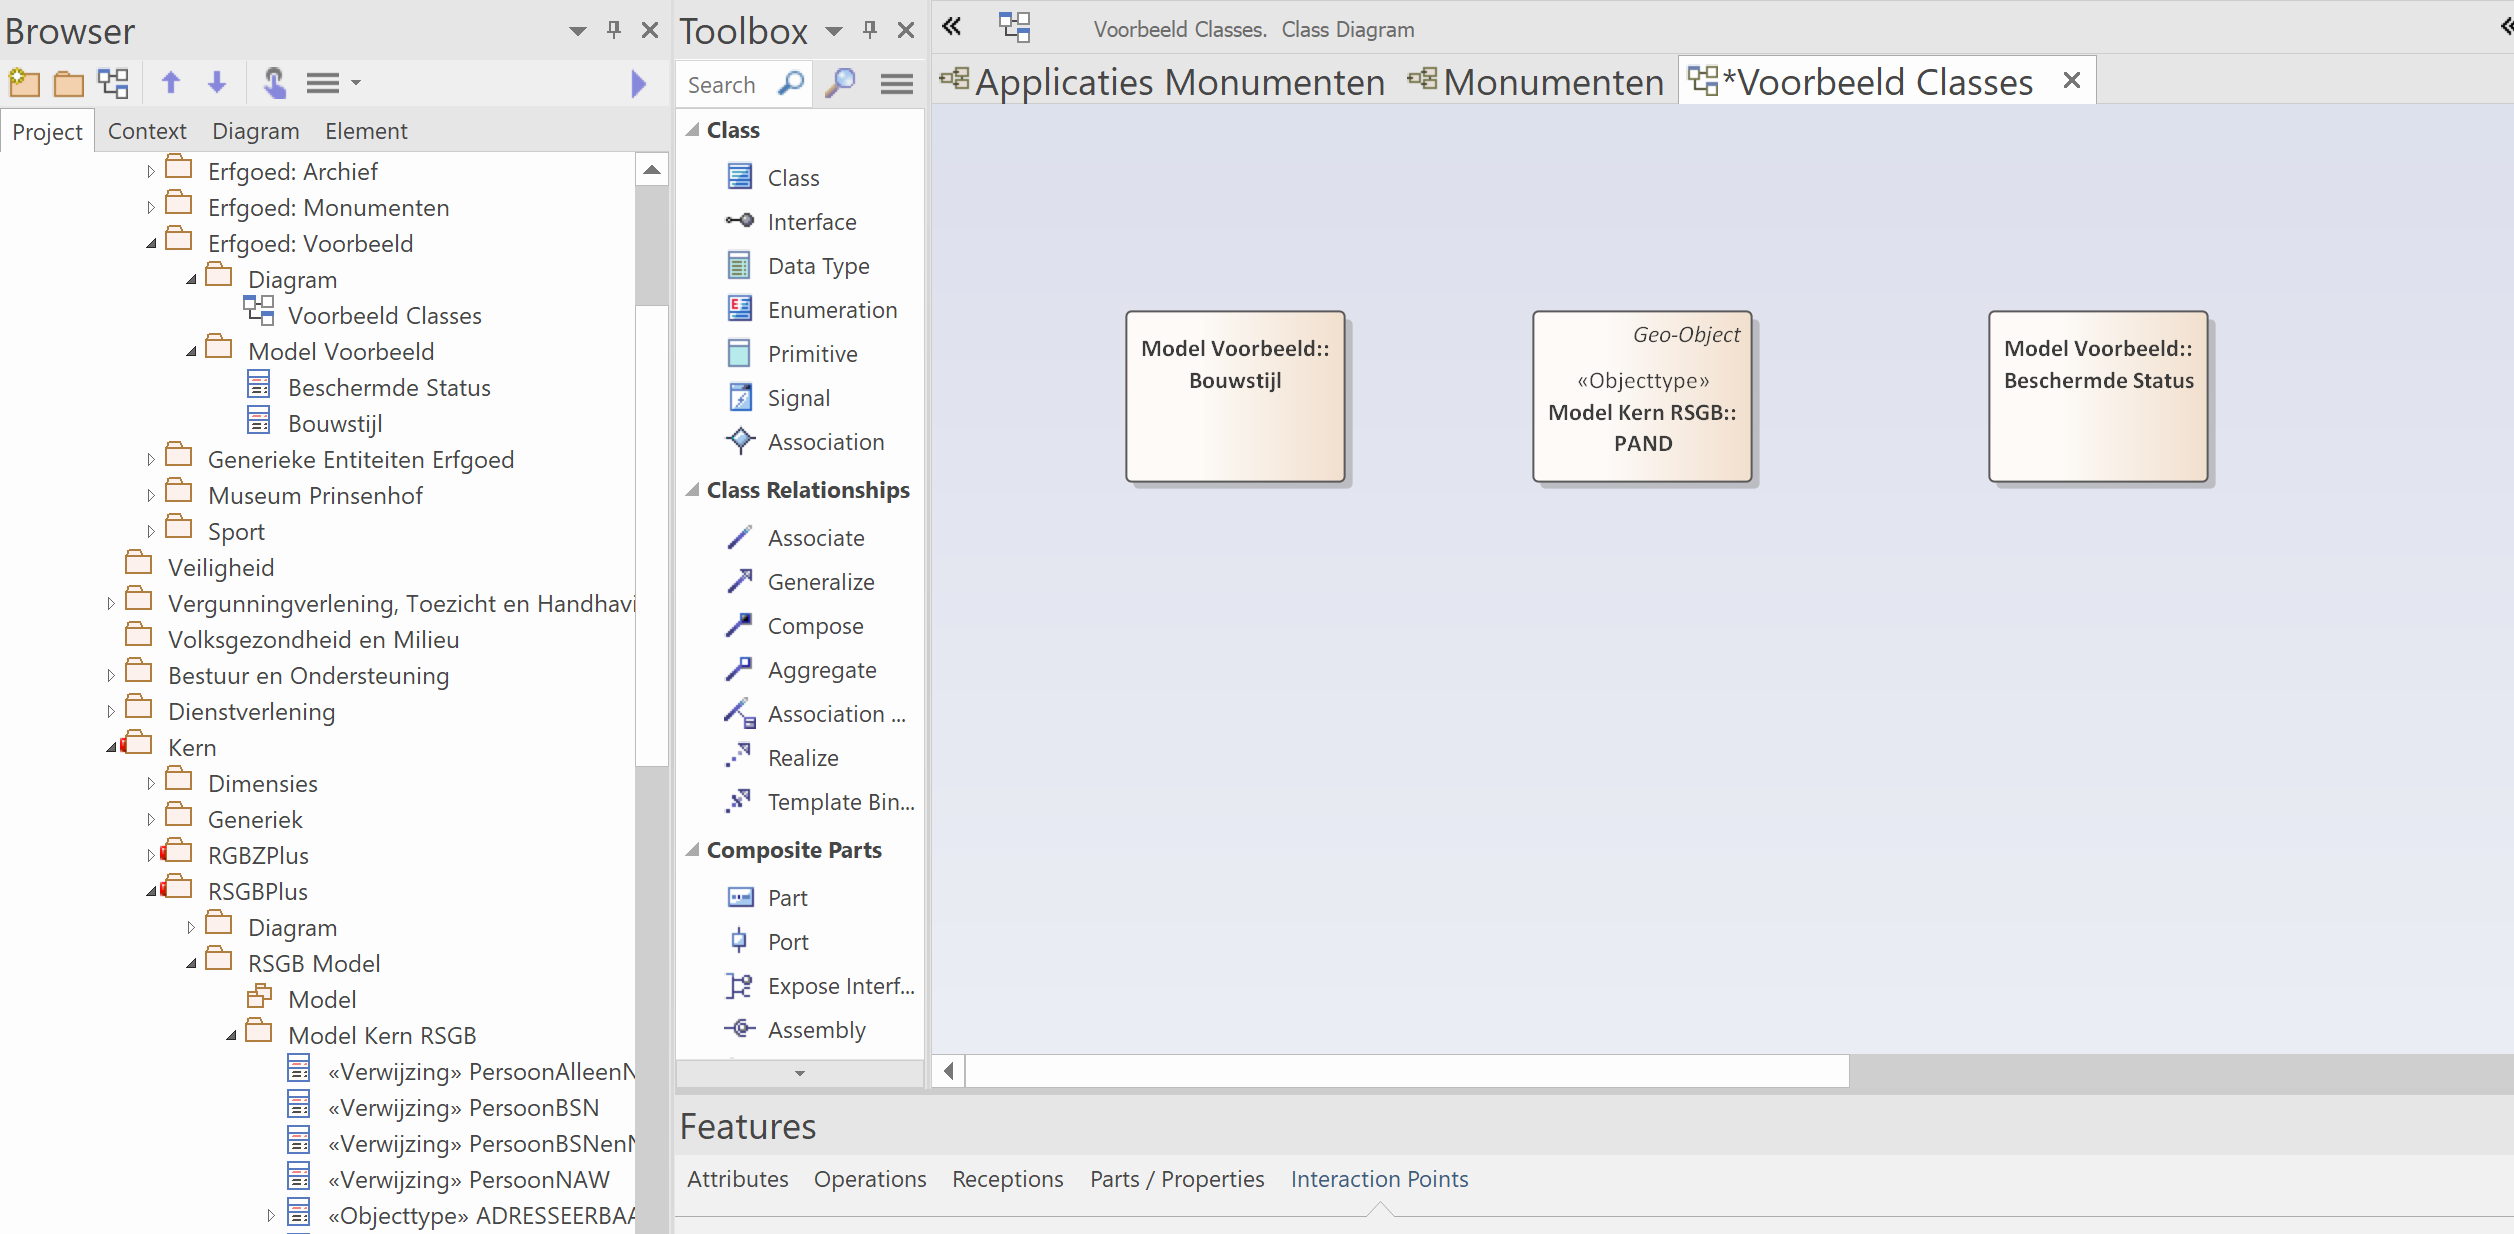
Screenshot: object types placed on the class diagram.
6. Create the relationships between these object types.
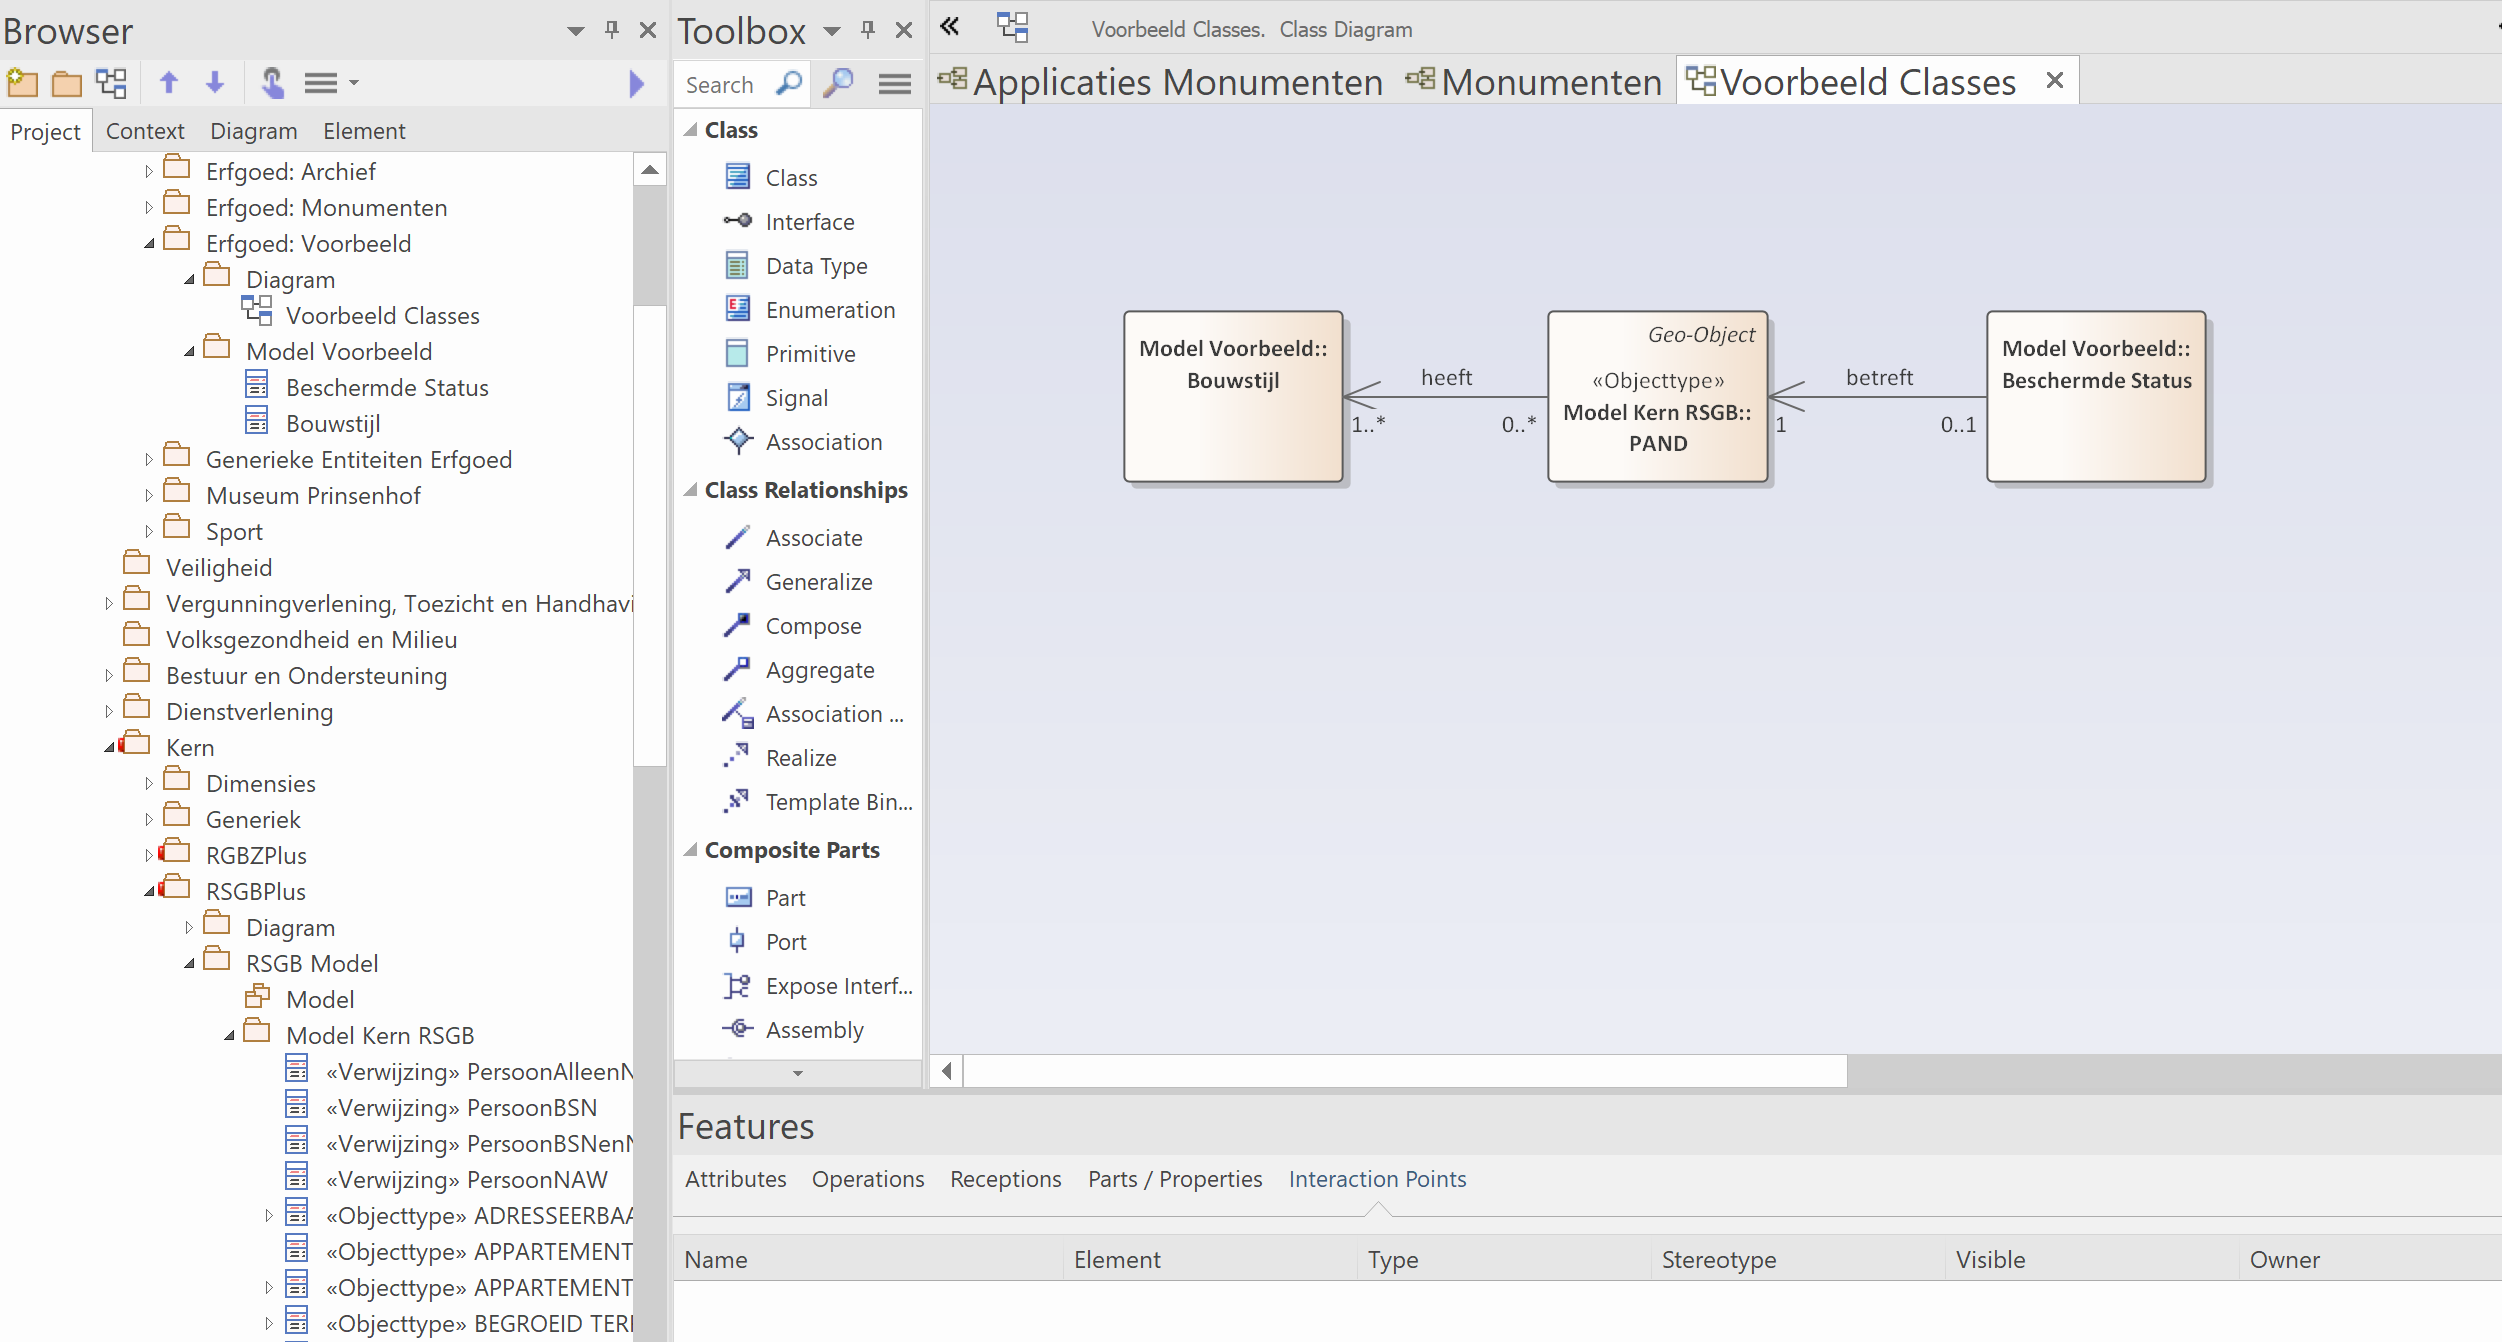
Screenshot: relationships added between object types.
7. Finally, add attributes to the just-created object types. Use the photos you took of the application, existing standards, or the application's database schema.
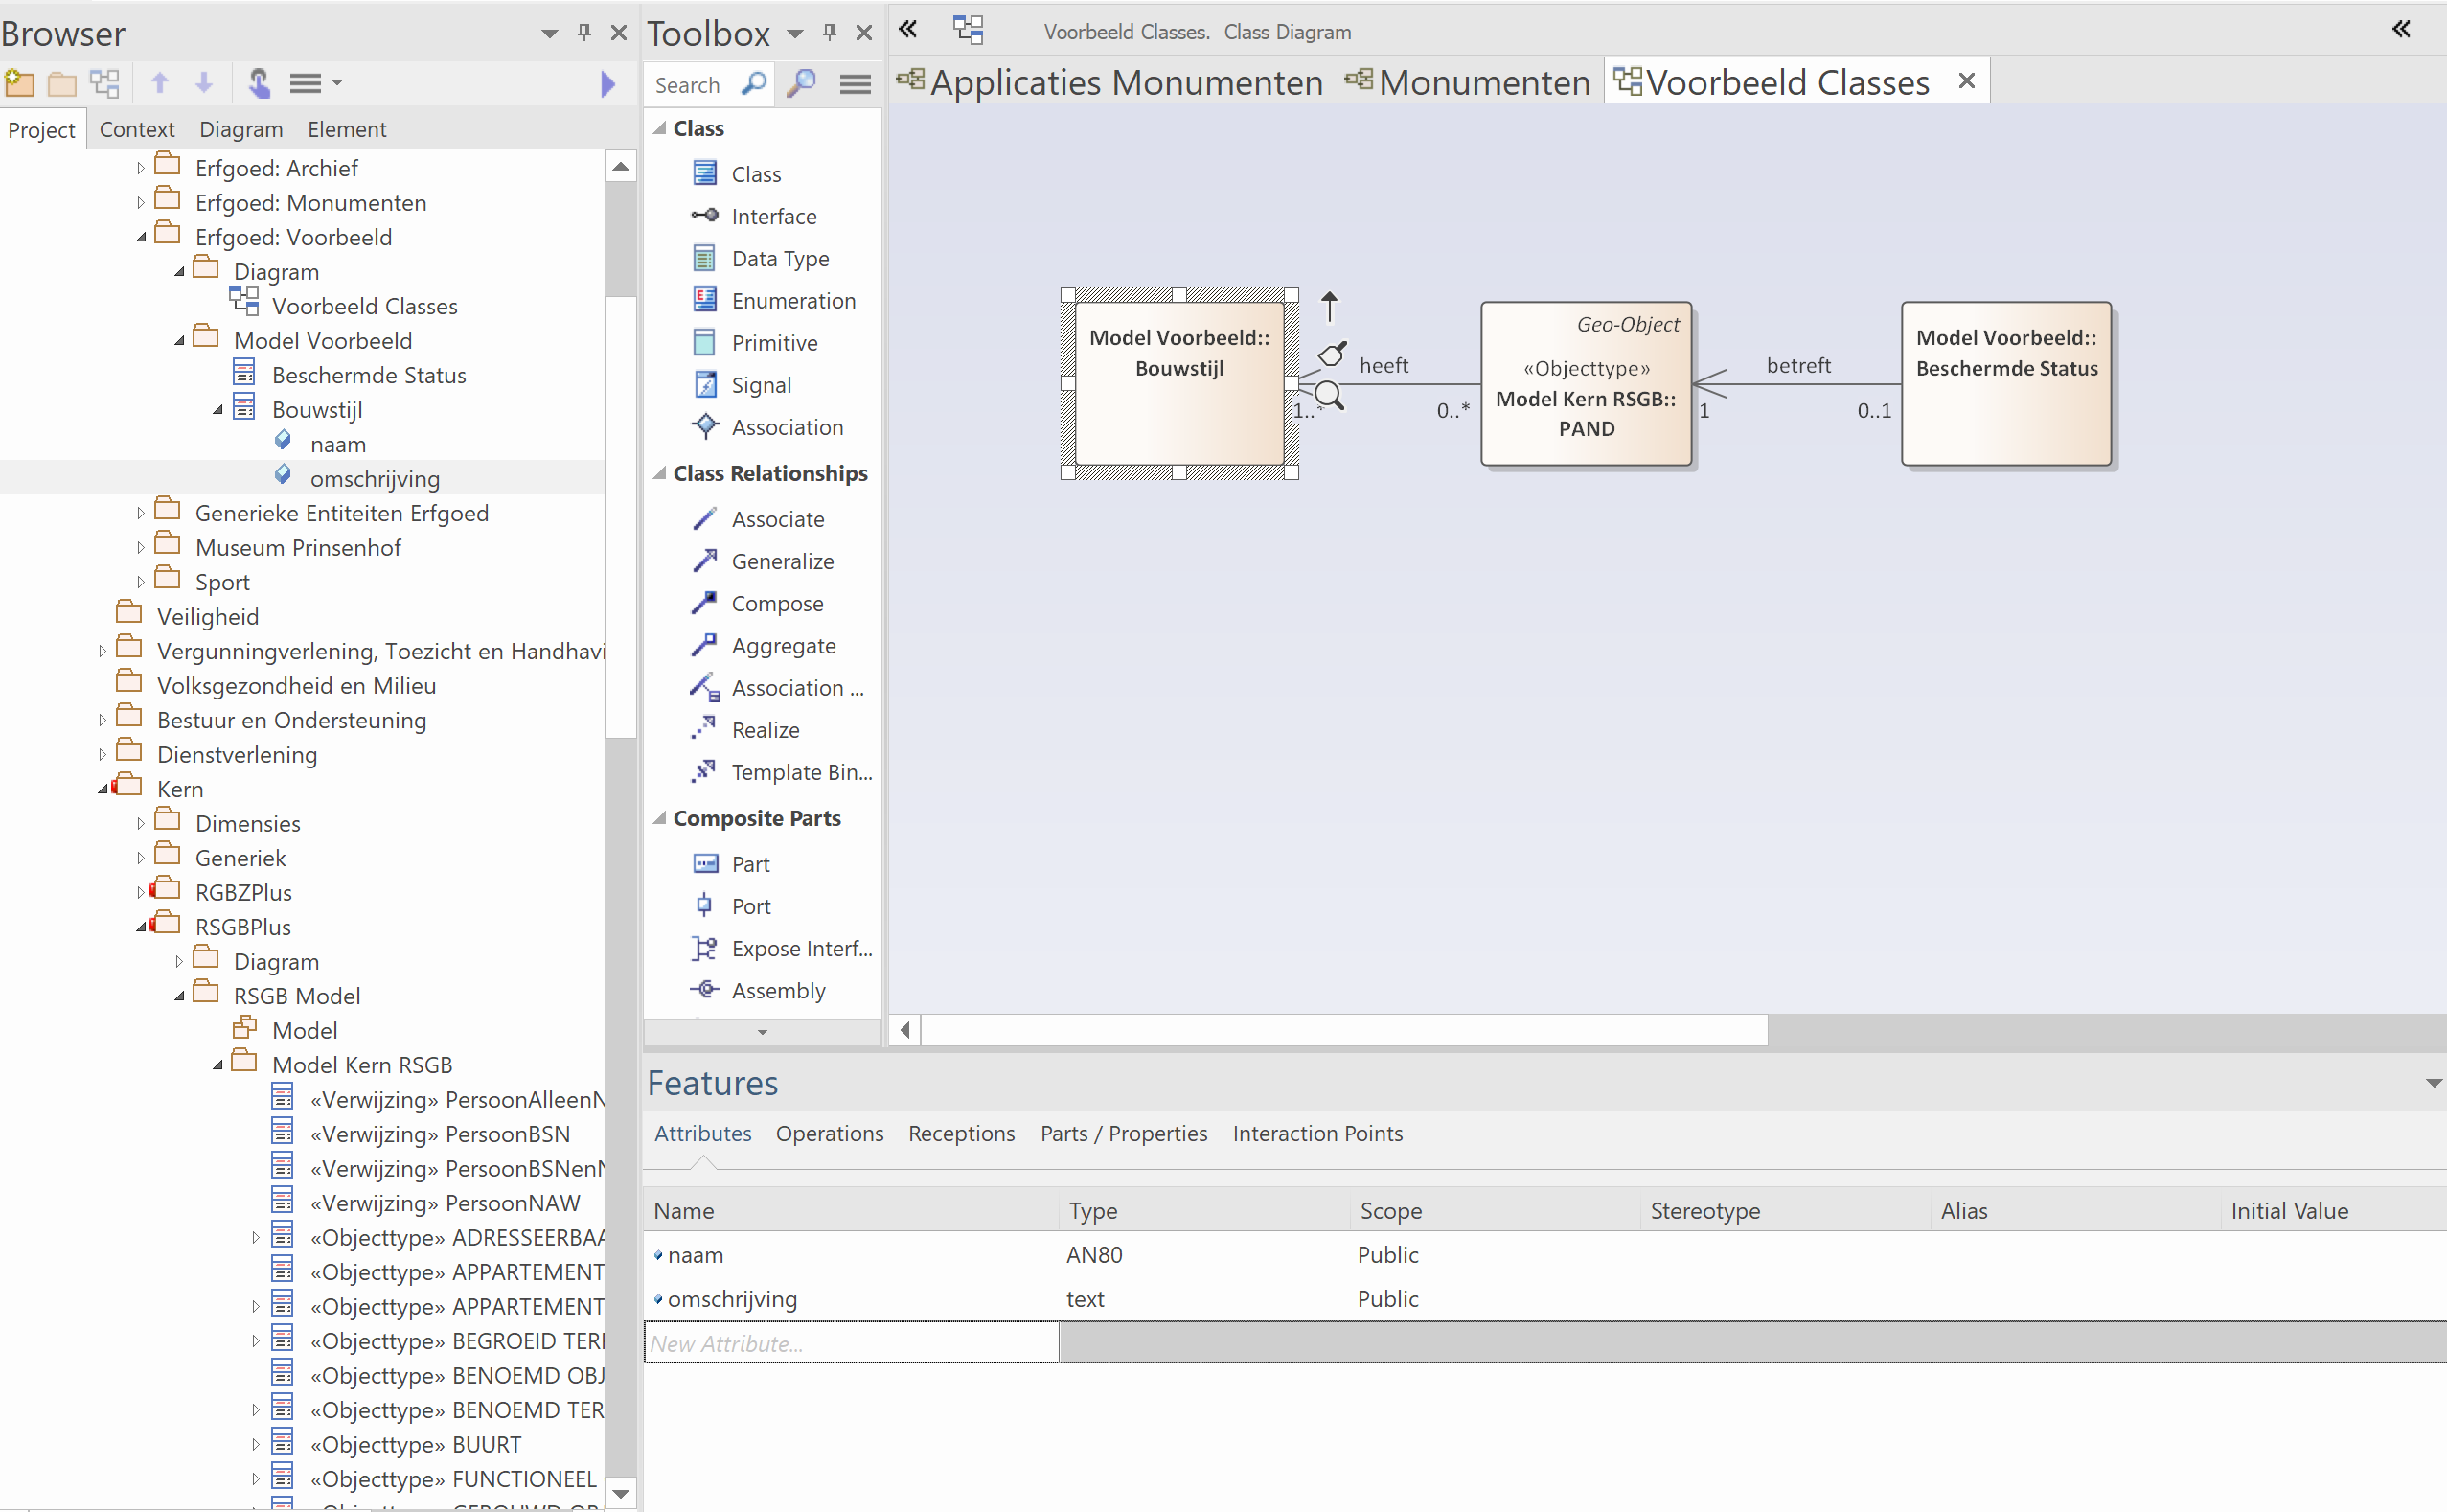
Screenshot: object types with their attributes.
8. Done — you have completed a full cycle of extending the GGM.
Producing the database schema
To use the just-extended part of the GGM in a database, generate it to DDL. Select or copy the relevant part of the GGM and follow this guide.